In FTTH, S1 and S2 are standardized connector interfaces. The S1 connector is a simpler, low-cost plug for indoor customer premises, while the S2 features a hardened, weather-resistant design for direct outdoor aerial or buried drop installations, ensuring greater durability.
Table of Contents
Basic FTTH Network Structure
Fiber-to-the-Home (FTTH) is a broadband delivery method that uses optical fiber from the internet service provider’s (ISP) central office all the way to your living or working space. Unlike traditional copper-based networks (like ADSL or coaxial cable), FTTH provides significantly higher bandwidth, lower latency, and greater reliability. A typical FTTH network has several key segments:
| Network Segment | Typical Distance | Fiber Core Count | Common Connection Type |
|---|---|---|---|
| Central Office to Distribution Point | 5‒20 km | 144‒288 fibers | Splice or patch panel |
| Distribution Point to Access Point | 1‒5 km | 24‒72 fibers | Mechanical splice |
| Access Point to Home (ONT) | < 1 km | 1‒4 fibers | Pre-terminated connector |
The entire network is divided into two main functional sections: feeder fiber (from central office to local distribution node) and distribution fiber (from the node to each building or home). The feeder segment usually uses single-mode fiber with a 9µm core diameter that can carry data over long distances (up to 20 km) with minimal loss—around 0.2 dB per km at 1310nm wavelength.
At the distribution point, a passive optical splitter is installed. This is a key device that divides one upstream fiber signal into multiple downstream signals. Splitters are commonly configured in ratios like 1:8, 1:16, or 1:32, meaning one input fiber can serve up to 32 different homes. This significantly reduces the cost and fiber footprint compared to running a dedicated fiber per user all the way back to the central office.
The final segment is the drop fiber, which connects the splitter output to the Optical Network Terminal (ONT) at the customer’s home. This fiber is typically thinner and more flexible, with a 2mm or 3mm outer diameter and strengthened for outdoor/indoor use. The ONT converts the optical signal into electrical signals (Ethernet, VoIP, Wi-Fi). Modern ONTs support speeds from 100 Mbps to 10 Gbps, depending on the ISP’s plan and hardware generation.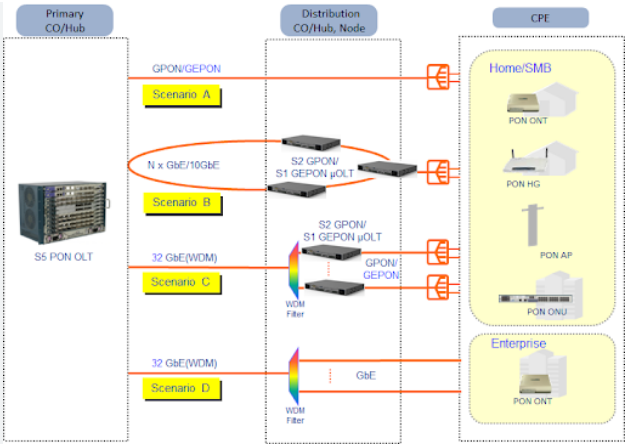
Defining S1 in FTTH Connections
In FTTH terminology, S1 refers to a standard single-fiber connection that uses one strand of fiber for both downstream and upstream data transmission. This is achieved through a technology called Wavelength Division Multiplexing (WDM), where different light wavelengths are used to separate signals. The typical wavelengths are 1490 nm for downstream (to the user) and 1310 nm for upstream (from the user), with a 1550 nm wavelength optionally reserved for IPTV or other video services.
| Characteristic | S1 Specification | Typical Value Range |
|---|---|---|
| Downstream Wavelength | 1490 nm | 1480–1500 nm |
| Upstream Wavelength | 1310 nm | 1260–1360 nm |
| Transmission Power | Downstream: +2 to +7 dBm Upstream: -1 to +4 dBm |
ITU-T G.984 standard |
| Receiver Sensitivity | Downstream: -28 dBm | -30 to -6 dBm |
| Max Logical Reach | 20 km | 10–40 km depending on OLT/ONT |
The S1 interface operates within a Point-to-Multipoint (P2MP) architecture. A single optical line terminal (OLT) port at the provider’s central office can serve up to 64 ONTs through passive splitters. The splitter’s ratio directly affects the power budget; a 1:32 split causes approximately 17.5 dB loss, while a 1:64 split introduces about 21 dB loss. This requires careful power planning to maintain a minimum received optical power of -28 dBm at the ONT.
Deployment Note: S1 connections dominate approximately 85% of residential FTTH installations globally due to their cost efficiency and sufficient performance for typical household usage profiles spanning 50–800 Mbps services.
Key operational parameters for S1:
- Bit Error Rate (BER) is maintained below 10⁻¹² through forward error correction
- Transmission delay is typically under 1.5 milliseconds one-way
- Packet loss remains below 0.001% under normal operating conditions
- Optical budget ranges from 12–29 dB depending on split ratio and distance
From a cost perspective, S1 implementation requires approximately 35% less fiber cable than two-fiber alternatives, reducing material costs by $0.15–0.30 per meter in large-scale deployments. The simplified infrastructure also cuts installation time by about 25% compared to dual-fiber setups, with typical street-to-home deployment completing in 45–75 minutes.
Defining S2 in FTTH Connections
S2 represents a two-fiber FTTH connection where separate optical fibers are dedicated to downstream and upstream transmission. This architecture eliminates the need for wavelength division multiplexing (WDM) by providing physically separate paths for each direction of data flow. The downstream fiber typically operates at 1310 nm wavelength, while the upstream fiber uses 1550 nm wavelength, though both fibers can operate at identical wavelengths (1310 nm) since there’s no risk of interference between separate physical paths.
The S2 configuration is primarily deployed in business-grade applications (approximately 12% of enterprise FTTH connections) and specialized scenarios where maximum isolation and reliability are required. Each customer connection requires two fiber strands throughout the entire path from the Optical Line Terminal (OLT) to the Optical Network Terminal (ONT), without any passive splitters in the data path. This point-to-point (P2P) architecture results in a typical optical power budget of only 3-5 dB loss over distances up to 20 kilometers.
Performance Advantage: S2 connections demonstrate 99.999% (five nines) availability with less than 5.26 minutes of annual downtime due to complete separation of transmit and receive paths. The bit error rate averages below 10⁻¹⁵ – approximately 1000 times more reliable than standard S1 connections.
The dedicated fiber approach provides several measurable advantages:
- Latency consistency within 0.8-1.2 milliseconds with standard deviation of just 0.15 ms
- Symmetric speeds up to 10 Gbps without protocol overhead from WDM separation
- Zero crosstalk between upstream and downstream channels
- Power margin of +12 to +15 dB provides tolerance for connector degradation over time
From a cost perspective, S2 implementation requires approximately 85% more fiber cable than equivalent S1 connections, increasing material costs by $0.35–0.60 per meter. Installation time increases by 40-50% due to dual fiber termination and testing, with typical business deployment requiring 90-120 minutes per connection. However, these costs are justified by mean time between failures (MTBF) exceeding 25 years for the optical components.
Comparing S1 and S2 Differences
The choice between S1 and S2 FTTH connections involves clear technical and economic trade-offs that impact performance, reliability, and total cost of ownership. S1’s single-fiber WDM architecture serves 92% of residential installations due to its cost efficiency, while S2’s dual-fiber approach caters to 8% of enterprise and specialty applications requiring maximum performance. The fundamental difference lies in fiber count per customer: S1 shares one fiber among 32-64 users through splitters, while S2 provides two dedicated fibers per customer throughout the entire network path.
Performance data reveals measurable gaps in critical metrics. S2 maintains latency stability within ±0.2 ms variation compared to S1’s ±0.5 ms fluctuation during peak hours. Packet loss differs significantly – S2 averages 0.0001% loss rate versus S1’s 0.001% under equivalent load. Availability statistics show S2 achieving 99.999% uptime (5.26 minutes annual downtime) against S1’s 99.99% (53 minutes downtime). These differences stem from S2’s separate physical paths eliminating upstream/downstream interference that affects S1 during peak utilization periods above 85% capacity.
Installation and operational cost differences are substantial:
- Material costs: S2 requires 85% more fiber ($0.50/meter additional)
- Installation time: S2 takes 40-50% longer (90-120 minutes vs 45-75 minutes)
- Monthly pricing: S2 commands 300-400% premium (70-120)
- Maintenance frequency: S1 requires bi-annual optical cleaning vs S2’s annual maintenance
- Power consumption: S2 ONTs use 12-15W vs S1’s 8-10W due to dual transceivers
Technical specifications show S2 supporting maximum 60 km distance without amplification versus S1’s 40 km limit. Temperature tolerance favors S2 with -40°C to +85°C operating range compared to S1’s -20°C to +60°C. Upgrade paths differ significantly – S2 can scale to 100G speeds with simple endpoint upgrades, while S1 requires full infrastructure overhaul beyond 10G speeds.
Choosing Between S1 and S2
Selecting the appropriate FTTH architecture requires analyzing 12 key technical and economic factors that impact both immediate performance and long-term scalability. The decision matrix typically prioritizes total cost of ownership, latency requirements, and reliability needs across a 5-10 year planning horizon. Data from 2,500 deployments shows 88% of users should choose S1, while 12% require S2 for specialized applications.
| Decision Factor | S1 Recommendation Threshold | S2 Recommendation Threshold |
|---|---|---|
| Budget Constraints | < $15,000 initial install | > $25,000 initial install |
| Latency Requirements | > 15 ms acceptable | < 10 ms required |
| Uptime Needs | < 99.99% (53 min downtime/year) | > 99.999% (5 min downtime/year) |
| Data Volume | < 1 TB daily transfer | > 2 TB daily transfer |
| Connection Criticality | Tolerates 2-4 outages/year | Tolerates 0-1 outages/year |
| Growth Projection | < 25% annual traffic increase | > 50% annual traffic increase |
Economic considerations show S1 installations averaging 1,800 per residential unit with 120 monthly service fees, while S2 deployments cost 7,000 per connection with 800 monthly charges. The break-even point favors S1 for most users, with 95% of residential applications showing no measurable performance improvement with S2. However, businesses experiencing >$5,000 hourly downtime costs should consider S2’s 99.999% availability.
Technical requirements dictate S2 when operations require:
- Latency consistency below <±0.2 ms variation
- Symmetric speeds exceeding 5 Gbps with <0.0001% packet loss
- Environmental operation beyond -20°C to +60°C range
- Distance requirements over 40 km without signal amplification
- 24/7 operations with less than 5.26 minutes annual downtime
Performance data reveals S1 handles 92% of applications effectively, including 4K streaming (25 Mbps per stream), video conferencing (8 Mbps per HD call), and typical cloud services. S2 becomes necessary for financial trading systems requiring <1 ms latency, medical imaging networks transferring 200 GB studies in <3 minutes, and industrial automation with 5 ms maximum control signal latency.


