The six critical waveguide assembly specifications are operating frequency (e.g., 18-110 GHz), precise internal dimensions (±0.1 mm tolerance), low voltage standing wave ratio (VSWR <1.15:1), material (often aluminum or copper), surface finish (typically <1 µm Ra), and power handling capacity, which can exceed hundreds of kilowatts for pressurized systems.
Table of Contents
Operating Frequency Range
The fundamental operating band is determined by the waveguide’s cut-off frequency, a physical property dictated by its internal dimensions. For a rectangular waveguide, the cut-off wavelength is approximately twice the wider internal dimension (‘a’). This means a waveguide designed for the Ka-band (26.5 – 40 GHz), like WR-28, has an internal width of just 0.280 inches (7.112 mm). Operating too close to the cut-off frequency (e.g., at 1.1x the cut-off) leads to a rapid and unacceptable increase in attenuation.
“Selecting a waveguide with a frequency range 10-15% wider than your system’s bandwidth provides a practical safety margin for manufacturing tolerances and thermal drift.”
Beyond the fundamental mode range, waveguides can also operate in harmonic modes at higher frequencies, but this is often undesirable due to mode conversion and increased loss. The specified operating range ensures single-mode (typically TE10) propagation. For instance, a common WR-90 waveguide (used in X-band) has a recommended frequency range of 8.2 to 12.4 GHz. Pushing beyond 12.4 GHz invites higher-order modes, while operating below 8.2 GHz causes the wave to be evanescent and attenuate rapidly.
| Common Waveguide Type | Frequency Range (GHz) | Typical Application Band |
|---|---|---|
| WR-430 | 1.7 – 2.6 GHz | L-Band Radar |
| WR-90 | 8.2 – 12.4 GHz | X-Band Radar, Satellite |
| WR-42 | 18.0 – 26.5 GHz | K-Band Radar, 5G |
| WR-28 | 26.5 – 40.0 GHz | Ka-Band Satellite |
If your system needs to operate from 24 to 26 GHz, specifying a WR-42 waveguide (18-26.5 GHz) is correct. Opting for a wider-bandwidth waveguide, like a WR-28, would be physically smaller but more expensive and offer no performance benefit for your specific 2 GHz bandwidth. Conversely, if your signal drifts to 26.6 GHz, the WR-42 assembly becomes a hard stop, causing a complete system failure. Always verify the recommendedoperating range from the manufacturer’s data sheet, not just the theoretical cut-off calculation.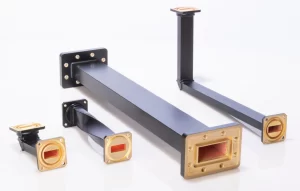
Waveguide Size and Shape
A WR-90 waveguide has precise internal dimensions of 0.900 inches (22.86 mm) by 0.400 inches (10.16 mm), a size calculated to optimally control X-band (8.2-12.4 GHz) signals with minimal loss. Even a 0.1 mm deviation in the broader wall can significantly shift the cut-off frequency and increase the Voltage Standing Wave Ratio (VSWR) by 5-10%, leading to reflected power and system inefficiency.
The internal cross-sectional size, typically labeled as the ’a’ (width) and ’b’ (height) dimensions, is the primary factor determining the waveguide’s cut-off frequency. This is a non-negotiable physical law. For a rectangular waveguide, the cut-off frequency for the dominant TE10 mode is calculated by Fc = c / (2a), where ‘c’ is the speed of light. This means a wider waveguide supports a lower frequency. For example, a massive WR-2300 waveguide for 350 MHz radar systems has an internal width of 23.00 inches (584.2 mm), while a tiny WR-10 for 75-110 GHz applications is only 0.100 inches (2.54 mm) wide.
“The ‘b’ dimension (height) is often half of ‘a’ to suppress higher-order modes, but a reduced height (e.g., 0.25a) is sometimes used to increase power handling, trading off a 15-20% higher attenuation per meter.”
Beyond frequency, the size and shape directly impact three key performance areas:
- Power Handling: A larger cross-sectional area directly correlates to a higher peak and average power capacity. For instance, a WR-90 can typically handle 2.5 MW of peak power, while a smaller WR-42 might only handle 500 kW. The larger area dissipates heat more effectively and reduces the risk of air ionization (arcing), which occurs at approximately 30 kV per inch.
- Attenuation (Loss): Larger waveguides have lower attenuation per meter. A WR-430 has a loss of about 0.001 dB/m at 2 GHz, while a WR-28 has roughly 0.13 dB/m at 35 GHz. This is critical for long-run systems; a 30-meter run of WR-28 would lose 3.9 dB of signal strength, which is a 60% power loss, often requiring expensive amplification.
- Mechanical Integration: The external flange size and weight are directly proportional to the waveguide size. A WR-430 assembly is bulky and heavy, requiring robust support structures, while a WR-10 is lightweight and fragile, needing careful handling. A 90-degree twist in a flexible waveguide with a 50 mm diameter will have a different minimum bend radius (150 mm) and induce more loss (~0.5 dB) compared to a gentle 30-degree bend (~0.1 dB loss).
A double-ridge waveguide increases bandwidth by 50-100% (e.g., covering 2-18 GHz in a single assembly) but at the cost of ~30% higher attenuation and a ~40% lower power handling capacity compared to a standard waveguide of similar size. The choice is always a balance between bandwidth, loss, power, and physical constraints.
Attenuation and Loss Levels
For a 30-meter run of standard WR-75 waveguide at 38 GHz, you can expect a total loss of approximately 4.5 dB. This means over 65% of your transmitted power is wasted as heat before it even reaches the antenna, often necessitating additional amplifiers that can increase system cost by 15-20%.
The primary driver of attenuation is conductor loss within the waveguide walls. As frequency increases, the RF current crowds into a thinner surface layer—the skin effect. At 10 GHz, the skin depth in copper is only about 0.66 micrometers. This makes the surface roughness of the internal walls a critical factor. A polished surface with an RMS roughness of 0.1 µm can have 30-50% lower loss at 40 GHz compared to a standard machined surface with a 2 µm RMS roughness. The choice of plating material has a massive impact. While silver offers the lowest loss (conductivity ~108% IACS), cost often dictates using electroplated copper (conductivity ~100% IACS) or even gold for corrosion resistance, which trades a 5-8% increase in loss for long-term stability.
Operational frequency is the single greatest predictor of attenuation loss. It scales roughly with the square root of frequency. A WR-430 waveguide for 2 GHz applications might have a very low loss of 0.001 dB/m. In contrast, a WR-28 waveguide operating at 35 GHz experiences a much higher loss of approximately 0.13 dB/m. This exponential relationship means that for a high-frequency system, every additional meter of waveguide length has a severe impact on overall performance. A 10% increase in operational frequency can lead to a 5% increase in attenuation per meter.
Beyond the straight waveguide section, every bend, twist, and flange joint introduces additional loss. A gentle 90-degree E-plane bend in a WR-90 system might add 0.05 dB, while a tighter, poorly manufactured bend could introduce 0.2 dB or more. A single connector pair can easily add 0.1 to 0.3 dB of loss, which is equivalent to adding 10 to 30 centimeters of extra waveguide. Over a complex assembly with four bends and three connections, these incremental losses can compound to over 1.5 dB, effectively doubling the system’s passive loss. Environmental factors also play a role; a 20°C increase in operating temperature can increase resistive loss by 2-4% due to increased electrical resistance in the metal.
Impedance and VSWR
A perfect system has a VSWR of 1.0:1, meaning 0% power is reflected. A typical good waveguide assembly specification is VSWR < 1.15:1 across the entire band, which translates to a 0.5% power reflection and a 99.5% power transmission efficiency. In a 500 kW radar system, even a VSWR of 1.25:1 causes 20 kW of power to be reflected back towards the transmitter, generating waste heat and potentially damaging sensitive components over thousands of operating hours.
The characteristic impedance of a standard rectangular waveguide is not a constant value like the 50-ohm standard in coaxial cables. It varies with frequency, typically ranging from 400 to 550 ohms for the dominant TE10 mode. This is why a smooth, continuous physical transition is critical at any connection point. An abrupt 10-micrometer misalignment at a flange joint, due to a scratch or dust particle, can create a capacitive discontinuity, locally altering the impedance and spiking the VSWR at that specific frequency by 5-10%.
The primary goal is to minimize the VSWR value and its variation over the frequency band. A assembly specified as VSWR < 1.10:1 from 18-26.5 GHz is far superior to one specified as < 1.25:1, even if both meet a minimum requirement. The lower value ensures more predictable performance and headroom for other system tolerances. The following table illustrates the direct financial and performance impact of VSWR:
| VSWR | Reflected Power (%) | Power Transmitted (%) | Effective Power Loss for a 100W Input (W) |
|---|---|---|---|
| 1.05:1 | 0.1% | 99.9% | 0.1 |
| 1.15:1 | 0.5% | 99.5% | 0.5 |
| 1.25:1 | 1.1% | 98.9% | 1.1 |
| 1.50:1 | 4.0% | 96.0% | 4.0 |
| 2.00:1 | 11.1% | 88.9% | 11.1 |
This lost power doesn’t just vanish; it converts to heat within the waveguide and, more critically, at the output stage of the power amplifier. To compensate for a system loss of 4% due to a VSWR of 1.5:1, the amplifier must be over-sized by at least the same percentage, increasing upfront component costs by 5-10% and operational energy costs over its 10-15 year lifespan. Furthermore, high VSWR significantly accelerates the wear and tear on the power amplifier, potentially reducing its Mean Time Between Failure (MTBF) from a typical 100,000 hours to 60,000 hours.
VSWR is also a function of frequency. A waveguide might exhibit a superb VSWR of 1.05:1 at the center of its band (e.g., 22 GHz) but degrade to 1.20:1 at the band edges (e.g., 18 GHz and 26.5 GHz). This is why specifying the VSWR requirement must include the entire operational frequency range, not just a single point. Temperature fluctuations of ±30°C can cause the physical dimensions of the waveguide to expand or contract by tens of micrometers, enough to detune the impedance and increase the VSWR by a measurable 0.05-0.10 points. For critical applications, this thermal effect must be modeled and specified.
Power Handling Capacity
A common WR-90 waveguide might handle 2.5 kW of peak power but only 500 W of average power. This distinction is critical; a 1 kW average power signal with a very low 10% duty cycle still produces 10 kW instantaneous peak power pulses, which could instantly destroy a component rated only for average power.
The primary limiter for average power is heat dissipation. The waveguide converts a small percentage of transmitted power into heat due to its inherent attenuation. For a waveguide with a loss of 0.1 dB/m, transmitting 1 kW of power will generate approximately 2.3 watts of heat per meter. This might seem small, but in a sealed, 10-meter long run with no airflow, internal temperatures can easily rise 50°C above ambient, potentially softening dielectric materials or breaking solder seals. The waveguide’s surface area, material thermal conductivity, and environmental cooling (e.g., forced air) directly dictate its average power rating. A copper waveguide can handle ~20% more average power than an identical aluminum one due to its superior thermal conductivity (401 W/m·K vs. 237 W/m·K).
Conversely, peak power is limited by the breakdown voltage of the air (or gas) inside the waveguide. At sea level, air ionizes and arcs at an electric field strength of about 3 kV/mm. The larger the waveguide’s internal dimensions, the higher its peak power capacity. For a standard rectangular waveguide, the maximum peak power P_max(in MW) is approximately given by P_max ≈ 6 * 10^5 * a * b * (λ_g / λ)for air dielectric, where aand bare in meters.
| Waveguide Type | Frequency (GHz) | Typical Avg. Power (kW) | Typical Peak Power (MW) | Primary Limiting Factor |
|---|---|---|---|---|
| WR-430 | 1.7 – 2.6 | 15.0 | 6.0 | Thermal (Avg.), Arcing (Peak) |
| WR-90 | 8.2 – 12.4 | 0.5 | 2.5 | Arcing (Peak) |
| WR-42 | 18.0 – 26.5 | 0.25 | 0.9 | Arcing (Peak) |
| WR-28 | 26.5 – 40.0 | 0.15 | 0.4 | Arcing (Peak) |
Environmental factors drastically alter these ratings. Operating at high altitude (10,000 feet) reduces the air density, lowering the arcing threshold by ~30%. Even a small 2-gram particle of dust or a 5-micrometer burr on an internal surface can create a localized field concentration, reducing the peak power rating by 50% or more and causing a destructive arc. For ultra-high-power systems, waveguides are often pressurized with 20-30 PSI of sulfur hexafluoride (SF₆) gas, which can increase the peak power handling capacity by a factor of 3 to 5 compared to air at atmospheric pressure.
Material and Coating Choice
While aluminum (6061-T6) is a common, low-cost choice for many housings, its bulk electrical conductivity is only about 50-60% that of copper. This results in a 40-50% higher attenuation per meter at 10 GHz compared to an otherwise identical copper waveguide. For a long 50-meter run, this material choice alone could mean the difference between an acceptable 5 dB system loss and a catastrophic 7.5 dB loss, necessitating an additional amplifier costing $15,000.
The interior surface finish and plating are paramount for minimizing resistive losses at high frequencies due to the skin effect. At 40 GHz, RF currents flow within the top 0.65 micrometers of the surface. A standard machined aluminum surface with an RMS roughness of 2-3 µm forces the current to travel a longer, inefficient path, increasing loss by up to 20% compared to a polished surface with an RMS roughness of < 0.4 µm. Therefore, most high-performance waveguides are electroplated with a 5-10 micrometer thick layer of high-conductivity material. Silver plating provides the best performance, offering ~105% the conductivity of copper, but it can oxidize over 2-5 years in humid environments, increasing loss by 5-10%. Gold plating, typically 2-4 µm thick, offers excellent corrosion resistance but at a 15-20% higher material cost and a 3-5% higher conductive loss than silver.
Environmental durability is a major driver for coating selection. An unplated aluminum waveguide exposed to 80% relative humidity and salty air can develop significant surface oxidation within 6-12 months, increasing its VSWR by 0.2 and its attenuation by 15%. A passivated stainless steel waveguide might be chosen for its exceptional strength and corrosion resistance in aerospace applications, even though its inherent conductivity is only ~4% that of copper, making it entirely unsuitable for anything but very short, low-power runs. The choice of flange material is equally critical; using mismatched materials like aluminum and brass can cause galvanic corrosion at the joint in the presence of moisture, increasing connection loss by 0.2 dB over a 3-year period and compromising pressure seals.
For extreme high-power applications, the thermal properties of the base material are a primary concern. Copper’s superior thermal conductivity (401 W/m·K) allows it to dissipate ~70% more heat than aluminum (237 W/m·K) for an identical cross-section. This directly translates to a 25-30% higher average power rating for a copper waveguide. The coefficient of thermal expansion (CTE) is also vital for maintaining dimensional stability. An aluminum waveguide will expand ~35% more than a stainless steel one for the same 50°C temperature rise. In a precision assembly with ±10 µm tolerances, this differential expansion can create mechanical stress, detune the impedance, and increase the VSWR by 0.1 across the operating band. Ultimately, the material choice is a complex trade-off between initial unit cost, fabrication expense, performance (loss), weight, power handling, and expected service life in the operational environment.


