To test a directional coupler, connect it to a signal generator (output: +10dBm, 2-4GHz) and spectrum analyzer. Measure input power (Pin) at the main port, coupled power (Pcouple) at the coupled port, and isolated port power (Piso). Calculate insertion loss (Pin-Pthru, typical 0.5-2dB), isolation (Pin-Piso ≥20dB), and directivity (Pcouple-Piso ≥30dB) to validate performance.
Table of Contents
Measure Insertion Loss
For a well-designed coupler operating in its specified band, such as 2–4 GHz, you expect this loss to be very low, typically between 0.1 dB and 0.5 dB. This seems small, but in a high-gain system or a multi-stage amplifier chain, even half a decibel of unexpected loss can degrade overall noise performance and output power. For instance, a 0.3 dB loss translates to a 7% reduction in power delivered to the load. The goal is to verify the manufacturer’s spec, often stated as “≤ 0.5 dB,” and ensure it holds across the entire frequency range, not just at a single point.
First, calibrate the VNA using a standard SOLT (Short-Open-Load-Thru) calibration kit for the frequency range you’re testing, say 1–6 GHz. This minimizes system error, bringing your measurement uncertainty down to around ±0.05 dB. After calibration, connect the coupler simply in a thru configuration: Port 1 of the VNA to the coupler’s INPUT port, and the OUTPUT port to Port 2 of the VNA. Ensure the coupled ports are terminated with high-quality 50-ohm loads that have a return loss better than -40 dB. This is crucial; any energy reflected from these ports can skew your insertion loss reading.
Now, set up a frequency sweep. For a 2–4 GHz coupler, a sweep with 10,001 points provides high resolution, revealing any narrow dips or peaks. The trace you’re looking for is S21 (transmission from port 1 to port 2). The key is to look at the minimum, maximum, and average value of S21 across the entire band. A good coupler will have a flat response. For example, the spec might be Insertion Loss: 0.4 dB ± 0.1 dB. If you see a sudden spike to 1.5 dB at 3.8 GHz, that’s a major red flag indicating a potential internal fault or impedance mismatch.
It’s also vital to consider the impact of cable losses. Your test setup itself has loss. If you’re using 1 meter of RG-316 cable, it might have a loss of 0.7 dB at 4 GHz. This is why calibration is done at the plane of the coupler’s ports—to remove these effects. Always use phase-stable, low-loss cables. For high-power applications, you might need to perform a power sweep. A coupler rated for 50 Watts average power should be tested at a low power level (e.g., +10 dBm) on the VNA first, and then its insertion loss should be verified at a higher power, say 20 W, using a signal generator and a power meter to ensure no performance degradation occurs.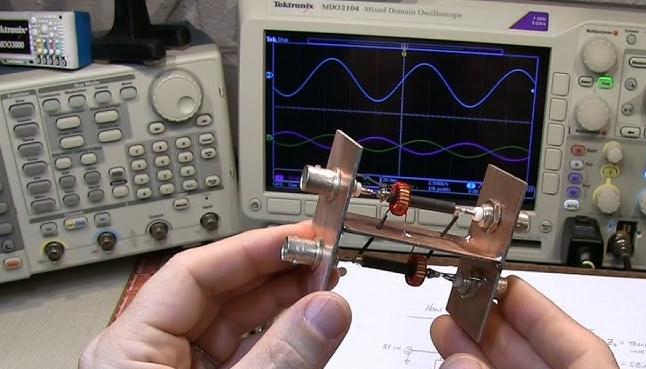
Check Directivity with Load
A high directivity, say 40 dB or greater, means your coupler is effectively isolating the forward signal, which is critical for accurate power and return loss measurements. For instance, a 30 dB directivity coupler used in a 2.4 GHz ISM band application can introduce a ±0.5 dB error in return loss measurements, which might be acceptable for basic tasks. However, for precision work like amplifier linearity testing or advanced antenna tuning, you need a coupler with 45 dB to 50 dB directivity to keep measurement errors below ±0.1 dB.
| Directivity (dB) | Approx. Error in Return Loss Measurement (±dB) |
|---|---|
| 20 | ±1.5 |
| 30 | ±0.5 |
| 40 | ±0.15 |
| 50 | ±0.05 |
First, calibrate your VNA to the end of your test cables. Then, connect the coupler: the INPUT port to Port 1, the OUTPUT port to Port 2, and terminate the ISOLATED port with a high-quality 50-ohm load. The key is the quality of this load; its return loss must be better than -40 dB (ideally -50 dB) across your frequency band. A poor load, with a -20 dB return loss, will reflect energy and severely corrupt your directivity reading, adding 1-2 dB of error. For the first measurement, terminate the COUPLED port with another pristine 50-ohm load and measure the reverse isolation, which is the S31 parameter (from Port 1 to the COUPLED port). Record this value at your frequency of interest, for example, -32.5 dB at 3.5 GHz.
Immediately after, without moving the cables, replace the perfect load on the COUPLED port with a calibrated short circuit. This short must have a known, near-perfect reflection, typically 0.0 dB return loss with a 180-degree phase shift. Now, measure S31 again. The value will be much higher; you might read -15.8 dB. The directivity is calculated by subtracting the first reading from the second: -15.8 dB – (-32.5 dB) = 16.7 dB. This is a surprisingly low result, highlighting why this test is so important. A good coupler should yield a result much closer to its datasheet value of 40 dB.
For a full characterization, perform a frequency sweep from 1 GHz to 6 GHz with 10,001 points. Plot the calculated directivity. You are looking for consistency. A sharp dip of 15 dB at 4.2 GHz indicates a resonance or design flaw, rendering the coupler unusable at that frequency. Environmental factors matter. Test at a stable 23°C ±3°C; ferrite cores can shift properties with temperature, reducing directivity by 2-3 dB at 60°C. Finally, use the same +10 dBm power level for all measurements.
Test Coupling Value Accuracy
A coupler specified as 20 dB should reliably extract 1% of the main line power. However, a slight deviation of ±0.5 dB from this nominal value introduces a ±12% error in your power calculations. This inaccuracy cascades through systems; if this coupler monitors a 50 W transmitter’s output, a +0.5 dB error (reading 19.5 dB) would lead you to believe the coupled power is 5.6 W, when in reality, it’s 5.0 W—a 12% over-estimation of the forward power.
| Frequency (GHz) | Nominal Coupling (dB) | Typical Measured Value (dB) | Acceptable Tolerance (±dB) |
|---|---|---|---|
| 2.0 | 20.0 | 20.1 | 0.3 |
| 4.0 | 20.0 | 20.5 | 0.4 |
| 6.0 | 20.0 | 21.2 | 0.6 |
To test this, use your calibrated VNA. Connect Port 1 to the INPUT, and terminate the OUTPUT port with a 50-ohm load. Crucially, you must also terminate the ISOLATED port with an equally high-quality load; leaving it open can skew results by 0.2-0.3 dB. The COUPLED port connects directly to Port 2 of the VNA. The parameter to measure is S21 from the INPUT to the COUPLED port. This might seem counterintuitive, but in this configuration, you are directly measuring the transmission of energy into the coupled path. Set your VNA to sweep from 1 GHz to 6 GHz with 10,001 points and a 0 dB output power. The trace will show the coupling value. A high-quality coupler will have a flat response; for a 20 dB model, you expect to see a nearly straight line at -20 dB.
The real test is in the deviation. Zoom in on the trace and observe the peak-to-peak variation. A spec of 20 dB ± 0.5 dB means your measurement must stay between -19.5 dB and -20.5 dB across the entire band. It’s common to see a slight linear increase with frequency; a shift from 20.1 dB at 2 GHz to 20.5 dB at 6 GHz is acceptable for many applications. However, a non-linear 1 dB peak at a specific frequency, like 3.8 GHz, indicates a poor design or a damaged unit. For absolute accuracy, compare your VNA reading against a trusted power meter. Inject a +20 dBm (100 mW) continuous wave (CW) signal at 2.5 GHz into the INPUT port. Measure the power at the COUPLED port with the meter. You should measure +0 dBm (1 mW), confirming the 20 dB coupling factor. Any significant discrepancy, like a reading of +0.5 dBm, points to a calibration error in your VNA or an inaccurate coupler.
Verify Frequency Response Range
A directional coupler’s specified frequency range—like 800 MHz to 2.5 GHz—isn’t just a suggestion; it’s the strict boundary where its key parameters (coupling, directivity, insertion loss) remain within usable limits. Operating outside this band, even by just 100 MHz, can lead to rapid performance decay. For example, a coupler designed for 2.4 GHz WiFi might show a coupling value of 20.1 dB at 2.4 GHz, but this can drift to 22.5 dB at 2.7 GHz, introducing a +15% error in power measurement.
- Coupling Value Variation: Track deviation from nominal value (e.g.,
20.0 dB ± 0.5 dB). - Directivity Minimum: Identify the lowest point of directivity, crucial for measurement accuracy.
- Insertion Loss Peak: Note the maximum insertion loss, which affects signal power.
- Return Loss Degradation: Monitor input and output port match (VSWR < 1.25:1 ideal).
To test this, configure your VNA for a continuous wave (CW) sweep across the entire claimed range plus an extra 10-15% on both ends. For a 2-4 GHz coupler, sweep from 1.8 GHz to 4.2 GHz. Use a high number of points—10,001 is ideal—to resolve narrow, problematic resonances that a 1001-point sweep would miss. Set the output power to a robust +10 dBm; lower power levels might not excite non-linearities, while higher levels could induce thermal drift over long sweeps. The goal is to create a detailed map of performance, not just a spot check at a few frequencies.
Simultaneously monitor all four S-parameters in a single display window. Watch S31 (coupling) for flatness. A gradual increase of 1.2 dB from the low end to the high end of the band might be acceptable per the datasheet, but a sharp 0.8 dB dip at 3.1 GHz indicates a manufacturing flaw or a damaged component. Observe S41 (isolation) to ensure it remains high, typically above 40 dB, and S11 (input return loss) to confirm it stays below -20 dB (VSWR < 1.22:1). The most critical view is the calculated directivity trace (derived from S31 and S32 measurements). A directivity drop below 25 dB at any point within the specified band, especially at the edges like 2.05 GHz or 3.95 GHz, renders the coupler unfit for precise applications like antenna tuning or reflected power monitoring.
Assess Port Impedance Match
A directional coupler’s effectiveness hinges on its ports seamlessly integrating into a 50-ohm system. Poor port match, often visualized as a voltage standing wave ratio (VSWR) greater than 1.25:1 (return loss worse than -14 dB), acts as a signal reflectometer within your circuit. At 3 GHz, a 1.35:1 VSWR at the input port reflects 4.5% of the incident power. This reflected energy distorts measurements, causing ripples in frequency response and introducing errors in forward and reflected power readings that can exceed ±0.4 dB.
- Input/Output VSWR: Must typically be < 1.25:1 (Return Loss > -20 dB) across the full band.
- Coupled Port Match: Often slightly worse; < 1.35:1 (RL > -17 dB) is acceptable.
- Isolated Port Match: Critical for directivity accuracy; should be < 1.30:1 (RL > -18 dB).
- Match Stability vs. Power/Temp: Impedance should not shift by more than ±0.05 in VSWR from -10°C to +55°C.
Terminate all three other ports with high-quality 50-ohm loads boasting a return loss better than -40 dB. For the INPUT port test, connect Port 1 of the VNA to it, and terminate the OUTPUT, COUPLED, and ISOLATED ports. The parameter to measure is S11. Set a sweep from 1 GHz to 6 GHz with 10,001 points. The key metric is the maximum value of S11 (or equivalently, the minimum return loss) over the coupler’s specified operating range, say 2 GHz to 4 GHz. You are looking for a smooth curve. A specification of 1.20:1 VSWR means your S11 trace must remain below -21 dB. A narrow spike peaking at -15 dB (1.43:1 VSWR) at 3.6 GHz indicates a resonance, likely from a faulty connector or internal imperfection, making the unit unreliable.
Repeat this process meticulously for each port. The OUTPUT port (S22) test follows the same procedure, with the OUTPUT connected to Port 1 and all other ports terminated. The COUPLED and ISOLATED ports (S33 and S44) are often slightly mismatched by design but must still meet their own datasheet specs, commonly < 1.35:1 VSWR. It is critical to test the COUPLED port’s match under actual operating conditions. This means testing S33 not only with the INPUT port terminated but also with the INPUT port driven by a 50-ohm source. The match can differ by 0.05 in VSWR between these two states; the datasheet value is almost always quoted for the terminated case.
Evaluate Power Handling Capacity
A directional coupler’s power handling rating—often listed as 50 Watts average and 500 Watts peak—defines its operational limits before performance degrades or permanent damage occurs. Exceeding the average power limit, even briefly, can cause internal temperatures to rise rapidly. For example, applying 60 W average power to a 50 W coupler can elevate its core temperature by 35°C above ambient in just 90 seconds, potentially altering its magnetic properties and shifting the coupling value by 0.4 dB. The peak power rating guards against voltage arcing; a 2 kW pulse applied to a 500 W peak-rated device can easily arc across the internal transmission line, creating a carbon track that permanently lowers its directivity by 15 dB.
“Never test a coupler at its absolute rated limit. For a 50 W unit, design your test to reach 45 W, then monitor for performance drift. This provides a 10% safety margin to account for measurement uncertainty and unforeseen load mismatches.”
To test average power handling, you need a signal generator, a 50-ohm dummy load rated for 100 W, and a power meter. Connect the generator to the INPUT port, the dummy load to the OUTPUT port, and terminate the coupled ports. Set the generator to a CW tone at the coupler’s most sensitive frequency—often the mid-band point like 3 GHz. Start at a low power level, like +20 dBm (0.1 W), and use the power meter to confirm the power at the output load. Gradually increase the input power in 5 dB steps, allowing 2 minutes at each step for thermal stabilization. At each step, measure the coupling value using a directional power meter on the COUPLED port. A stable coupler will show less than ±0.1 dB change in coupling from 5 W to 45 W. A gradual drift of -0.3 dB as power climbs indicates core heating and potential failure.
Peak power testing requires a pulsed signal generator capable of high peak power, like 1 kW, and an oscilloscope with a high-power probe. Set the pulse width to 10 µs and a 1% duty cycle (PRF: 1 kHz). Apply this signal to the INPUT port. Use the oscilloscope to monitor the waveform at the COUPLED port. You are looking for arcs or distortion. A clean, replicated 10 µs pulse on the scope confirms the coupler can handle the peak voltage. A distorted pulse with 3 dB of ringing indicates an impedance issue under high voltage.
| Power Rating | Test Power Applied | Duration | Max Allowed Coupling Drift | Max Case Temp Rise |
|---|---|---|---|---|
| 50 W Avg | 45 W | 60 minutes | ±0.2 dB | +55°C |
| 100 W Avg | 90 W | 60 minutes | ±0.2 dB | +60°C |
| 500 W Peak | 450 W Peak | 10,000 pulses | ±0.3 dB | +25°C |
A hotspot exceeding 95°C on the case indicates poor internal thermal transfer, which will shorten the component’s lifespan from 10 years to under 2 years. After the one-hour 45 W test, immediately measure the DC resistance of the transmission line through the INPUT and OUTPUT ports. A significant change in resistance (more than 5%) indicates internal damage from overheating.


