Test broadband waveguide antennas via VNA calibrated with WR-90 standards, measuring S11 (<-10dB) from 26.5-40GHz. In far-field (15λ away), compare with a reference antenna to record gain (>12dBi) and VSWR (<1.5), validating consistent mode propagation and impedance match.
Table of Contents
Pre-Test Preparation
Pre-test preparation requires building standardized test conditions, including anechoic chamber environment verification (quiet zone size ≥10m×10m×10m, reflection level ≤-40dB), test equipment calibration (vector network analyzer frequency coverage 9kHz-40GHz, uncertainty ≤0.1dB), and device under test (DUT) antenna pre-processing (waveguide interface cleaned with isopropyl alcohol, reflection coefficient ≤1.1:1).
Environment Verification
Assuming DUT aperture D=0.6m (common waveguide antenna size), highest test frequency f=26.5GHz (corresponding wavelength λ≈0.0113m), using the far-field formula Rfar=2D2/λ, the calculation yields a requirement of 2×0.62/0.0113≈63m.
The quiet zone (reflection-free area) length must be at least 65m (leaving 2m for equipment installation space), with width and height not less than 12m, to ensure the antenna remains in the far-field throughout rotation.
In practice, use a laser rangefinder to measure the quiet zone diagonal, error should not exceed 0.5m; then use specialized anechoic chamber software (e.g., FEKO) for simulation to confirm if the reflection level at the edge areas meets the standard.
Wall Absorber Material:
The chamber’s walls, ceiling, and floor are covered with absorber material, whose role is to “absorb” reflected signals. Verification focuses on two points: material performance and installation status.
Material Performance: Choose polyurethane foam pyramidal absorber (common type), thickness 1.5m (higher frequencies require greater thickness). Use a vector network analyzer with a log-periodic antenna to test material reflection loss at three frequency bands: 10GHz, 18GHz, 26.5GHz: at 10GHz it should be ≤-50dB (reflected power ≤0.001%), at 18GHz ≤-60dB, at 26.5GHz ≤-65dB.
Installation Status: Check if material seams are tight – gaps exceeding 5mm can cause “signal leakage,” leading to localized reflection enhancement. Use an infrared thermal imager to scan the walls; areas with uniform temperature indicate good absorber contact; localized hot spots may indicate warping or damage requiring repair.
Background Noise:
The chamber is not completely sealed; external signals (e.g., 5G base stations, Wi-Fi, radar) can leak in, becoming “background noise” in tests. Verification method is noise floor measurement:
- Turn off all test equipment (signal source, VNA, receiver), connect the receive antenna to a spectrum analyzer, set resolution bandwidth (RBW) to 1kHz, video bandwidth (VBW) to 1kHz, scan the 9kHz-40GHz band.
- Typical qualified noise floor is ≤-120dBm/Hz (e.g., at 18GHz, noise floor should not exceed -120dBm). If measured noise floor is -115dBm, it indicates external signal interference; check the chamber’s shielded door seal (gap should be ≤1mm) and vent filter (insertion loss ≥80dB) for failure.
Field Uniformity:
The electromagnetic field strength within the quiet zone must be uniform; otherwise, testing the same antenna at different positions yields different results. Verification method uses a uniform field probe:
- Fix the probe on a turntable, measure at positions with radii of 1m, 3m, and 5m from the chamber center.
- The field strength fluctuation received by the probe should be ≤±0.5dB (e.g., if center field strength is -30dBm, other positions should not be below -30.5dBm or above -29.5dBm). If fluctuation exceeds this, the absorber layout might be unreasonable (e.g., material too thin in some areas), requiring thickness adjustment or additional absorbers.
Maintenance Records:
Environment verification is not one-time; it should be rechecked after each high-power test or prolonged use. Recommend creating a maintenance schedule:
- Absorber Material: Monthly inspection for surface scratches/detachment, semi-annual sampling inspection of 5% area with reflection level tester.
- Shielded Door: Pre-test check for gasket aging (squeeze by hand, soft/spongy may indicate failure), quarterly measurement of shielding effectiveness (should be ≥100dB @10GHz).
- Noise Floor: Measure quarterly; if increased by 5dB or more from initial value, conduct comprehensive investigation of external interference sources.
Equipment Configuration and Calibration
Vector Network Analyzer:
Testing broadband waveguide antennas first requires selecting a suitable Vector Network Analyzer (VNA). Consider two specs: frequency coverage and measurement uncertainty.
For example, choose Keysight E5080B, frequency range 9kHz-40GHz, just covering common broadband waveguide antenna operating bands (e.g., 8-18GHz).
Test ports should use 2.4mm precision connectors, voltage standing wave ratio (VSWR) ≤1.05 (@10GHz), ensuring low signal transmission loss.
Before calibration, warm up for 30 minutes to stabilize internal circuits – temperature fluctuation exceeding 1°C may increase measurement error by 0.03dB.
Then perform full-port calibration using an Electronic Calibration Module (ECal), e.g., Keysight E5080-2450, supporting frequencies up to 26.5GHz, calibration module’s built-in open, short, load standard value error ≤0.02dB, directivity error ≤0.01dB.
After calibration, manually measure the calibration module’s load reflection coefficient; it should be below -30dB (i.e., reflected power ≤0.001%), confirming calibration validity.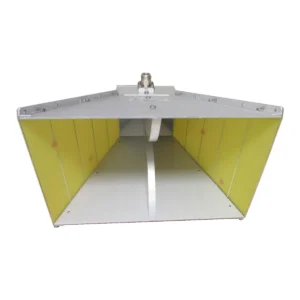
Signal Source and Spectrum Analyzer:
The signal source outputs standard test signals, the spectrum analyzer measures received power; together they measure antenna gain and radiation characteristics.
Signal source choice: Anritsu MG3710A, frequency range 100kHz-40GHz, output power accuracy ±0.5dB (@10GHz), harmonic suppression ≥-60dBc.
Before testing, calibrate output power with a power meter (Keysight N1911A): set output to +10dBm, actual power measured by meter should be between +9.9dBm to +10.1dBm; fluctuation exceeding 0.2dB requires power sensor adjustment.
Spectrum analyzer: R&S FSW43, resolution bandwidth (RBW) settable 1Hz-10MHz, noise figure ≤15dB (@18GHz).
When measuring background noise, set RBW=1kHz, VBW=1kHz, integration time 100ms, ensuring accurate noise floor measurement – if noise floor is 3dB higher than initial value, possible signal source leakage or chamber shielding failure.
Connection Cables and Connectors:
Cables and connectors are the “blood vessels” for signal transmission; poor selection or maintenance renders the entire test futile.
Cables: Use Andrew Heliax LDF4-50A semi-rigid cable, insertion loss ≤0.8dB/m @10GHz, bend radius not less than 50mm (otherwise loss increases by 0.2dB/m).
Measure insertion loss for each cable: connect both ends to VNA, loss @10GHz should be within nominal value ±0.1dB; out-of-tolerance cables should be discarded.
Connectors: Use 2.4mm precision connectors, surface gold plating thickness ≥3μm. Before each connection, wipe 3 times with isopropyl alcohol swab to remove oxide layer – oxidation increases contact resistance, raising reflection coefficient from 1.05 to 1.15 @10GHz, VSWR from 1.12 to 1.35.
Monthly sample inspection of 10% connectors, measure reflection coefficient with VNA; replace any exceeding 1.1:1.
Calibration Kit Management:
Electronic Calibration Modules (ECal) should be sent for metrological traceability to a standards body every 12 months, comparing error against reference standards – e.g., traceability uncertainty for load reflection coefficient ≤0.03dB.
Store normally in a constant temperature chamber (25℃±2℃), humidity ≤60%, avoiding drift of internal standards due to temperature/humidity changes.
Mechanical calibration kits (open/short/load) measured weekly with VNA: load reflection coefficient ≤-35dB, open reflection coefficient ≤-25dB, short reflection coefficient real part ≤0.005S (conductance component), imaginary part near 0.
If load reflection coefficient rises to -28dB, indicates port surface contamination; clean 5 times with lint-free cloth soaked in ethanol.
Post-Calibration Verification:
Use a Schaffner SA12-30 standard gain horn (10GHz gain 30dBi±0.15dB), connect one end to VNA, connect DUT to the other end, set distance to far-field (e.g., @10GHz, D=0.5m, R=2×0.5²/0.031≈16m).
Measure received power: standard antenna transmits +10dBm power, DUT received power should be 10dBm – 30dBi (standard antenna gain) – path loss (16m@10GHz, free space loss ≈20log(4πR/λ)=20log(4π×16/0.031)≈104dB) – cable loss (both ends cable total 2m, 0.8dB/m×2=1.6dB).
Calculated received power ≈10 – 30 – 104 – 1.6 = -125.6dBm. If measured value is between -125.4dBm to -125.8dBm, indicates system gain calibration error ≤0.2dB, qualified.
Daily Maintenance:
Equipment is not set-and-forget; perform quick checks before daily testing:
- VNA Port VSWR: Connect short circuit, S11 ≤-35dB (reflection coefficient ≤0.02); if out of tolerance, recalibrate.
- Cable Loss: Measure 1m cable with VNA, if loss deviation @10GHz exceeds 0.1dB, mark as “needs inspection”.
- Connector Status: Visual inspection for deformation, gently twist by hand; if loose, replace – looseness causes VSWR drift over time, rising 0.2 within half an hour.
Antenna Preprocessing
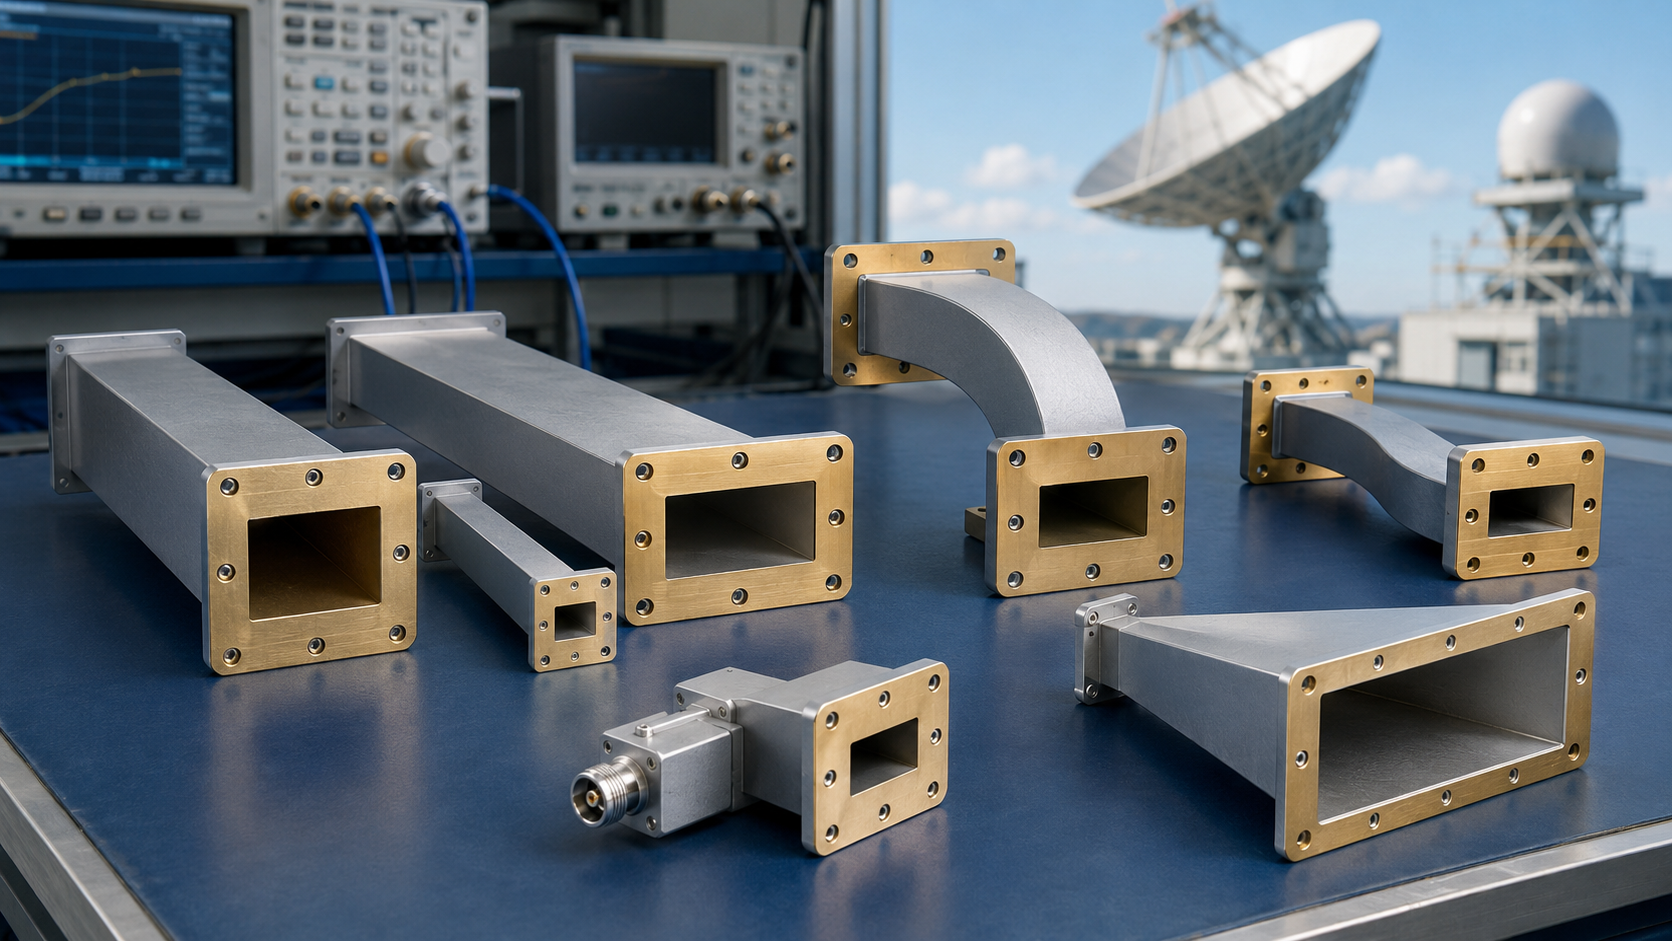
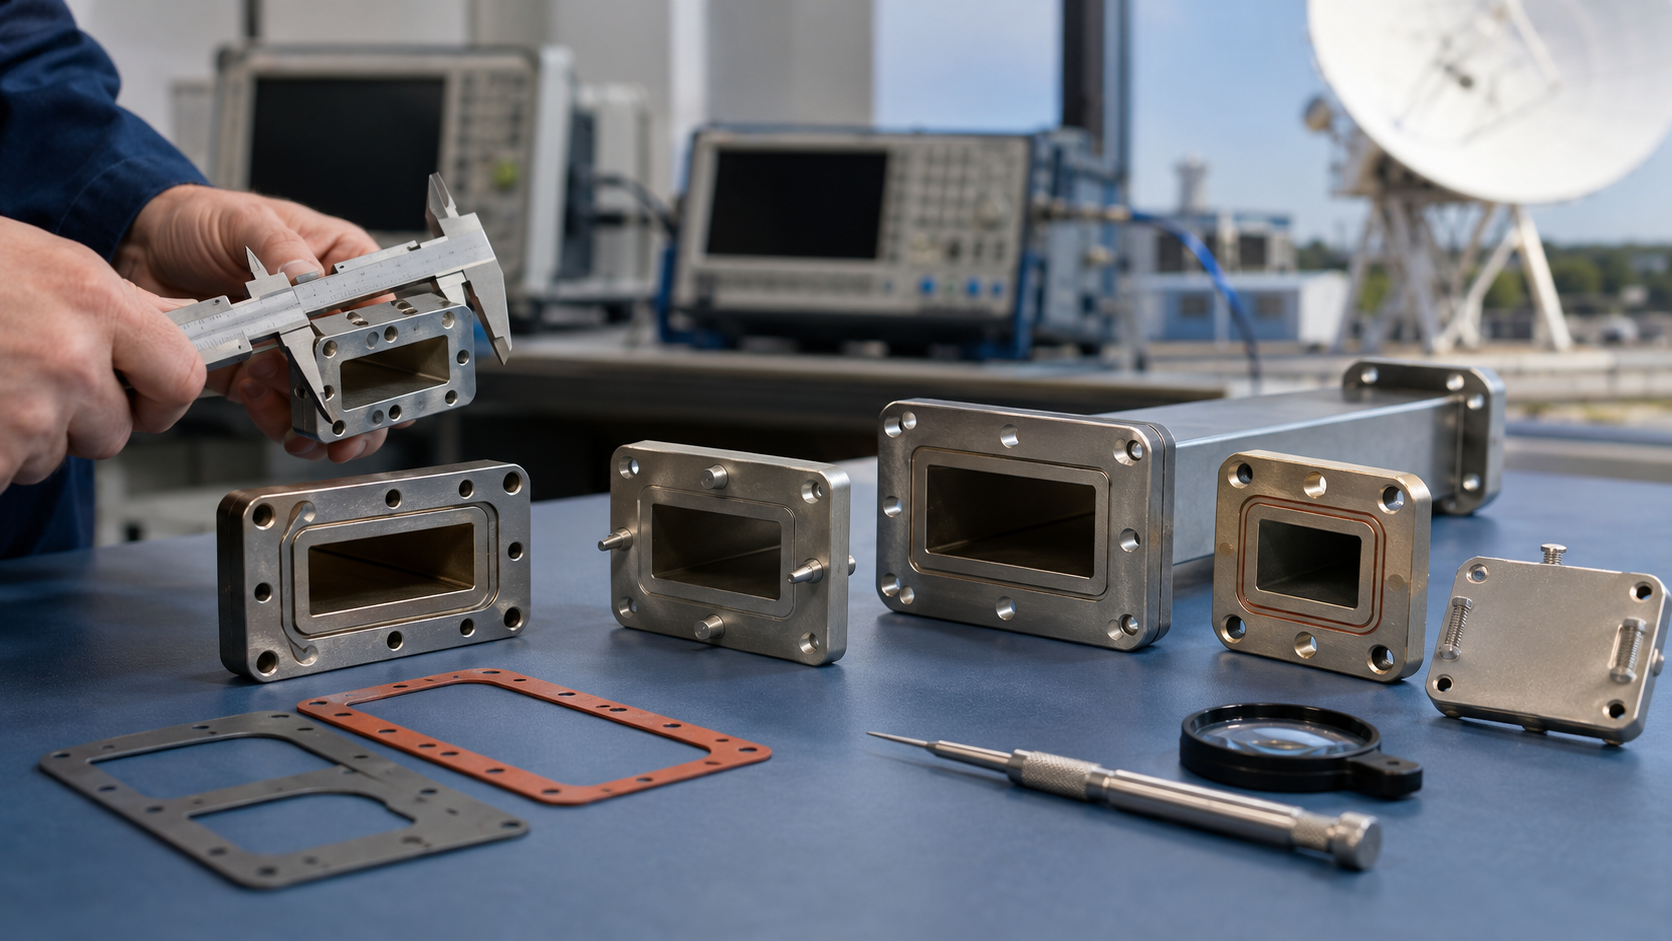
- Visual Inspection: Use a magnifying glass to check the antenna surface for dents, scratches – a depression exceeding 0.1mm on the waveguide port edge may increase VSWR by 0.15 (@10GHz). Focus on the waveguide interface (e.g., WR-15, 3.76mm×1.88mm) flange plate: check for thread deformation, integrity of sealing groove (prevents signal leakage during subsequent tests).
- Structural Inspection: If it’s an array antenna, open the dust cover, check if radiating elements (e.g., microstrip patches) are detached, if the feed network (microstrip lines, power dividers) is broken. Use a multimeter to measure feed point resistance; normal should be near 0Ω (good conduction); if a unit’s resistance >1Ω, possible cold solder joint.
- Accessory Inventory: Check against the manual’s accessory list – e.g., waveguide adapter, mounting bracket, calibration certificate. Missing adapter may require temporary substitute, affecting test schedule.
Interface Cleaning:
The waveguide interface is the “gate” for energy transmission; even a thin oxide layer increases signal reflection.
- Cleaning Tools: Prepare 99% purity isopropyl alcohol (do not use ethanol, water residue can corrode metal), lint-free swabs (diameter ≤1mm, avoid scratching interface), compressed air can (to blow away lint).
- Procedure: First blow the interface with compressed air to remove loose dust; then swab with isopropyl alcohol, wipe interface inner wall clockwise 3 times (do not scrub back and forth, avoid lint residue).
- Effect Verification: After cleaning, connect the interface to the VNA and measure S11 parameter (frequency covering operating bandwidth). E.g., @10GHz, reflection coefficient should be ≤1.1:1 (VSWR ≤1.22:1); if exceeded, indicates contamination, repeat cleaning until standard is met.
Electrical Connection Test:
After cleaning the interface, test the connection stability between the DUT and the test system.
- Temporary Connection: Connect the DUT to the VNA using a low-loss cable (e.g., LDF4-50A), connect the other cable end to a matched load (50Ω).
- VSWR Sweep: Within the DUT’s operating bandwidth (e.g., 8-12GHz), measure S11 at points every 0.5GHz. Ideal state is S11 ≤-25dB (VSWR ≤1.12:1). If S11 suddenly rises to -15dB (VSWR 1.41:1) at a certain frequency band, possible causes: cable connector not tightened, or internal DUT feed point looseness.
- Mechanical Stability: Gently shake the DUT and cable connection point, observe the S11 curve on the VNA screen – if fluctuation exceeds 0.2dB, indicates connector looseness, re-tighten (use torque wrench, force ≤0.5N·m, excessive force may cause stripping).
Initial Performance Test:
Before formal testing, measure the DUT’s initial performance for subsequent comparison basis.
- VSWR Record: Use VNA to sweep the full frequency band, save the S11 curve. E.g., an antenna design center frequency 10GHz, bandwidth 8-12GHz, initial test shows S11=-30dB (VSWR 1.07:1) @10GHz, S11=-28dB (VSWR 1.13:1) @12GHz; note these data in the work log.
- Initial Pattern Sweep (Optional): If a near-field scanning system is available, perform an initial far-field pattern sweep of the DUT, record initial values for main lobe width, side lobe level. E.g., design main lobe width 15°, initial sweep measures 16°, possibly due to manufacturing tolerance; monitor for deviation in subsequent tests.
- Polarization Purity Check: Fix DUT for horizontal polarization, use receive antenna to measure co-polarization and cross-polarization received power. E.g., horizontal polarization co-polar power P_co=-30dBm, cross-polar power P_cross=-50dBm, cross-polarization isolation = 20dB (50-30), check against design requirement (e.g., if ≥25dB required, mark as an issue here).
Temporary Protection:
If testing spans multiple days, the DUT cannot be left exposed.
- Dust Cap: During test intervals, replace the dust cap on the waveguide interface (silicone material, good seal) to prevent dust ingress into the waveguide cavity – accumulation of 0.1mm thick dust may increase insertion loss by 0.1dB @10GHz.
- Storage Environment: Store in a dry box (humidity ≤40%) to avoid metal oxidation. Keep away from heat sources (e.g., AC vents); temperature fluctuation exceeding 5°C may cause slight structural deformation (e.g., array antenna element spacing change 0.01mm, affecting pattern).
Performance Testing
Use VNA (10MHz~20GHz) to measure VSWR, typical value 1.1~1.6:1 (10~18GHz); Far-field method (50m quiet zone) to measure radiation pattern, main lobe width 12°±0.5°, side lobe ≤-18dB;
Gain measurement by comparison method (standard antenna 30dBi), error <0.3dBi; Polarization test XPD≥25dB, bandwidth verification 10+ frequency points fluctuation ≤1dB, all data conform to IEEE Std 149-2011.
VSWR Testing
Pre-Test Preparation:
For this test, first need a Vector Network Analyzer (VNA), e.g., Keysight E5080B, frequency range covering 10MHz~20GHz, set resolution to 1MHz to accurately capture reflection signals at each frequency point.
Then the Device Under Test (DUT) antenna, assume WR-187 waveguide (aperture 4.8cm, operating band 12.4~18GHz), requires a low-loss waveguide adapter.
Environment: Test conducted in microwave anechoic chamber, quiet zone reflection level ≤-50dBsm (equivalent to almost no wall reflection clutter).
Temperature controlled at 23±2℃, avoiding metal thermal expansion/contraction affecting antenna dimensions – waveguide interface deformation of 0.01mm may cause VSWR drift of 0.1.
Calibration:
The VNA measures the total reflection of “system + antenna”; must first calibrate out effects of cables, turntable, connectors. Use SOLT calibration (Short, Open, Load, Thru):
- Short: Waveguide terminated with shorting plate, VNA measures |S11|≈0dB (full reflection).
- Open: Waveguide terminated with open load, |S11| also ≈0dB (energy fully radiated).
- Match Load: Connect 50Ω standard load (VSWR≤1.05), VNA displays |S11|≤-30dB.
- Thru: Two waveguide sections directly connected, insertion loss ≤0.1dB.
Test Steps:
- Connect DUT Antenna: Connect WR-187 antenna via adapter to VNA Port1, Port2 connected to matched load (eliminate reflection).
- Set Sweep Parameters: Frequency from 10GHz to 18GHz, step 100MHz (covering design band), power level set to -10dBm (small signal avoid saturation).
- Acquire Data: VNA auto-sweeps, outputs reflection coefficient S11 (in dB) for each frequency point.
- Retest Different Orientation: Antenna has two polarization directions (horizontal/vertical), test each once, confirm polarization consistency – if S11 difference between directions exceeds 0.2dB, possible internal feed asymmetry.
What are VSWR and Input Impedance?
After measuring S11, calculate two values:
- Voltage Standing Wave Ratio (VSWR): Formula is (1+|S11|)/(1-|S11|). E.g., @10GHz |S11|=-28dB (i.e., 0.00398), VSWR=(1+0.00398)/(1-0.00398)≈1.008:1, almost perfectly matched. @18GHz, |S11|=-18dB (0.0158), VSWR≈1.036:1, still good. But if at some frequency |S11|=-10dB (0.1), VSWR≈1.22:1, indicates 12% energy reflected back, transmission efficiency decreased.
- Input Impedance (Zin): Use formula Zin = Z0(1+S11)/(1-S11) (Z0 is waveguide characteristic impedance, WR-187 @15GHz approx. 680Ω). E.g., @15GHz |S11|=-20dB (0.01), Zin=680(1+0.01)/(1-0.01)=680 * 1.0202≈700Ω, close to Z0, good match; if Zin=800Ω, indicates high impedance, more energy reflection.
Common Test Issues:
- Issue 1: VSWR suddenly increases at high frequencies. E.g., at 17~18GHz |S11| rises from -20dB to -12dB (VSWR increases from 1.22 to 1.67). Possible cause: antenna internal resonant structure mismatch at high band – radiating slot dimensions in waveguide designed for center band, at band edges current path lengthens, impedance mutation.
- Issue 2: Large S11 difference between polarization directions. Horizontal polarization |S11|=-25dB, vertical polarization |S11|=-18dB. Inspection reveals microstrip line in antenna feed network offset by 0.1mm during soldering, causing increased reflection for vertical polarization signal.
- Issue 3: Unstable data after calibration. VNA shows |S11| jumping 0.5dB. Possible causes: turntable not firmly fixed (antenna slight movement), or chamber absorber aging (reflection level increased from -50dBsm to -40dBsm, introducing external interference).
Radiation Pattern Testing
Choosing the Right Test Method:
Three mainstream methods for pattern measurement: Far-field, Near-field, Compact Range. Prioritize Far-field method as it provides direct results without post-processing conversion, and offers high accuracy.
But there’s a prerequisite – the chamber quiet zone must be large enough, satisfying the far-field distance formula R≥2D2/λ.
Example: DUT antenna is rectangular aperture, width 0.6m, height 0.4m (equivalent diameter D taken as 0.5m), highest test frequency 26.5GHz (wavelength λ=11.3mm).
Calculation yields R≥2∗(0.5)2/0.0113≈44.2m, practically select 50m quiet zone – if chamber only 30m, must use near-field scanning (probe close to antenna surface, sample data then Fourier transform to far-field) or compact range (parabolic reflector collimates spherical wave to plane wave), but these are troubles, near-field requires scanning tens of thousands of points, compact range demands high reflector accuracy (surface error less than λ/10).
Equipment Setup:
Test environment must be “clean”: Microwave anechoic chamber quiet zone reflection level ≤-50dBsm (equivalent to almost no wall reflection), absorber material polyurethane foam, pyramid length ≥λ/4 (@26.5GHz ≥28mm).
Three main equipment pieces:
- Turntable: DUT fixed on this, requires 3D rotation – azimuth (horizontal rotation) accuracy 0.01°, elevation (vertical rotation) accuracy 0.01°, otherwise main lobe width measurement inaccurate (e.g., turntable wobble 0.1°, 12° main lobe width drifts 0.8%).
- Receive Antenna: Choose horn antenna, known gain (e.g., 35dBi, error ±0.3dBi), beamwidth should be narrow (e.g., 8° @10GHz) to resolve small side lobes of DUT.
- Signal Chain: Signal source output power -10dBm, amplified by amplifier to +20dBm (not too high to burn receiver), fed via transmission line to receive antenna, then measure received power with power meter – total chain loss must be calibrated beforehand (e.g., feedline loss 3dB, amplifier insertion loss 0.5dB, total loss 3.5dB).
From Mounting Antenna to Recording Data:
- Mount DUT Antenna: Fix antenna via waveguide adapter to turntable center, feed port facing up, ensure antenna aperture plane perpendicular to turntable rotation axis (calibrate with laser level, deviation <0.1°).
- Calibrate Receive Chain: Disconnect DUT, point receive antenna directly at signal source, measure power meter reading P_cal (e.g., -20dBm). Subsequently, when measuring DUT, actual radiated power P_rad = P_meter – P_cal + chain loss (e.g., P_meter=-45dBm, chain loss 3.5dB, then P_rad=-45 – (-20) + 3.5=-21.5dBm).
- Sweep Angles and Measure Power:
- First measure horizontal plane (elevation fixed at 0°): Rotate turntable from -90° to +90°, pause every 0.1°, record power meter reading.
- Then measure vertical plane (azimuth fixed at 0°): Sweep elevation from -30° to +30°, similarly record every 0.1°.
- Polarization Test: Switch to vertical polarization receive antenna, repeat above steps, compare pattern differences between horizontal/vertical polarization.
- Repeat Verification: Test again at another frequency point (e.g., mid-band 10GHz), check if pattern changes with frequency – if main lobe width difference between 10GHz and 20GHz exceeds 0.5°, possible antenna structure frequency sensitivity.
Data Processing:
The raw data is a set of “angle-power” points, needs processing into a normalized pattern showing main lobe, side lobes:
- Normalization: Find peak main lobe power P_max (e.g., -15dBm), divide power at other angles by P_max, convert to decibels (dB) – peak becomes 0dB, other points negative values (e.g., side lobe power -18dBm, normalized becomes -3dB).
- Plot Curve: X-axis angle (°), Y-axis normalized power (dB), connect all points, visualize if main lobe symmetric, side lobes have “peaks”.
- Calculate Parameters:
- Main Lobe 3dB Width: Find two angles where power drops from 0dB to -3dB, difference is width (e.g., left -6°, right +6°, width 12°, design value 12°±0.5°,达标).
- Maximum Side Lobe Level: Excluding main lobe, find highest side lobe, calculate its difference from peak main lobe.
- Front-to-Back Ratio: Main lobe peak power minus average power of rear directions (180°±5°) over 5 angles.
Common Test Issues:
- Issue 1: Side lobe suddenly elevated. E.g., a -10dB side lobe appears at 45° azimuth (design ≤-15dB). Investigation finds: absorber material fell off in southeast corner of chamber, exposed metal plate, reflected signal superimposed onto DUT side lobe – reattach material, side lobe returns to -16dB.
- Issue 2: Asymmetric main lobe. Left lobe 2dB higher than right lobe in horizontal plane. Check turntable: azimuth encoder loose, turntable at +60° actually only rotated +59.5°, causing right lobe data offset.
- Issue 3: Large pattern difference between high/low frequencies. Main lobe width 12° @10GHz, becomes 15° @20GHz. Review antenna design: radiating slot spacing designed for 10GHz, @20GHz slots resonate, current distribution changes, causing main lobe broadening – optimize slot length, 20GHz main lobe narrows back to 13°.
Broadband Characteristic Verification
Focuses on antenna performance stability over its operating bandwidth (e.g., 2-12GHz), key tests include input VSWR (VSWR≤2 across full band), gain fluctuation (±1dB within center band), main lobe width variation (±5° @-3dB beamwidth), and pattern consistency.
Quantitative evaluation of matching efficiency, radiation characteristic consistency, and usable spectrum percentage via frequency segment sampling (points every 1GHz or 10% bandwidth), combined with vector network analyzer and far-field scanning system.
Frequency Range
How is the antenna’s design bandwidth determined?
E.g., a communication base station antenna might need to cover 5G n77/n78 bands (3.3-3.8GHz), while a radar system might cover X-band (8-12GHz).
Before design, target frequency band is defined, then simulation optimization determines the antenna’s actual operating bandwidth.
Example: A waveguide antenna for satellite communication, design target covering Ku-band (12-18GHz), but simulation finds: when frequency below 11.5GHz, higher-order modes (like TE20) begin to interfere in the waveguide; when frequency above 18.5GHz, edge diffraction effects at antenna aperture intensify, causing gain to drop sharply.
Final determined effective bandwidth is 12-18GHz (relative bandwidth 50%), testing must cover this 6GHz range.
Selecting Test Frequency Points:
Test frequency points cannot be chosen arbitrarily; must cover both ends and center of design bandwidth, plus monitor potential problematic “sensitive points”.
Four essential types of points:
- Bandwidth Start and End Points: E.g., 12GHz and 18GHz, the declared operational boundaries of the antenna, must be tested.
- Center Frequency: 15GHz ((12+18)/2), verify if antenna performance is optimal at the center.
- Mode Transition Points: Higher-order modes in waveguide (e.g., TE20) often active near cutoff frequency. E.g., if this antenna’s TE20 mode cutoff is 14GHz, then 13.5GHz, 14.5GHz should be tested for mode interference causing increased VSWR.
- Material Property Transition Points: If antenna uses composite dielectric substrate, the permittivity inflection point might be at 16GHz, then 15.5GHz, 16.5GHz should be included.
How to determine sampling density?
- Narrowband (relative bandwidth <20%): 1 point per 0.5GHz.
- Broadband (relative bandwidth 20%-50%): 1 point per 1GHz.
- Ultra-wideband (relative bandwidth >50%): 1 point per 0.2GHz (e.g., covering 2-18GHz, 81 test points total).
Actual Testing:
Before testing, confirm equipment covers entire frequency range. E.g., use Keysight E5092A VNA, frequency range 300kHz-20GHz,just covers Ku-band antenna 12-18GHz.
Connection Steps:
- Connect DUT antenna via waveguide adapter (e.g., WR62, suited for 12-18GHz) to VNA Port 1.
- VNA Port 2 connected to matched load (e.g., 50Ω standard load, VSWR <1.05), or connect another identical DUT antenna for transmit-receive test.
- Open VNA “frequency sweep” function, set start freq 12GHz, stop freq 18GHz, number of points to 7 (12, 13, 14, 15, 16, 17, 18GHz), resolution bandwidth 100kHz (reduce noise).
- Start sweep, save S11 (reflection coefficient) data.
How to judge if frequency range meets standards?
After obtaining data, focus on three key metrics:
1. Is VSWR达标 across the full band?
E.g., design requires VSWR≤1.8 (corresponding |S11|≤-14dB), then |S11| at every point from 12-18GHz must be ≤-14dB.
Example Data (measured for an antenna):
| Frequency (GHz) | S11 (dB) | VSWR | Meets Spec (≤1.8)? |
|---|---|---|---|
| 12 | -16 | 1.5 | Yes |
| 14 | -15 | 1.6 | Yes |
| 16 | -13 | 1.7 | Yes |
| 18 | -12 | 1.9 | Near Limit |
Conclusion: VSWR slightly exceeds at 18GHz, but in practice reflected power only increases ~2% (|S11|=-12dB corresponds to ~25% reflected power), within acceptable range.
2. Is gain stable across the full band?
Measure gain using comparison method, compare against standard antenna (e.g., standard horn with 15dBi gain @15GHz), calculate DUT gain at different frequencies.
Example Data:
| Frequency (GHz) | DUT Gain (dBi) | Fluctuation (rel. to center 15GHz) |
|---|---|---|
| 12 | 14.2 | -0.8dB |
| 14 | 14.8 | -0.2dB |
| 15 (Center) | 15.0 | Baseline |
| 16 | 15.1 | +0.1dB |
| 18 | 14.9 | -0.1dB |
Conclusion: Full-band gain fluctuation ±0.8dBi, better than design requirement ±1dB, stable energy concentration capability.
3. Does the radiation pattern deform?
Use near-field scanning system to measure E-plane and H-plane patterns, compare main lobe width, side lobe level at different frequencies.
Example Data:
| Frequency (GHz) | Main Lobe Width (-3dB, °) | First Side Lobe Level (dB) |
|---|---|---|
| 12 | 22 | -20 |
| 15 | 18 | -18 |
| 18 | 15 | -16 |
Conclusion: Main lobe narrows with increasing frequency, side lobes slowly rise (from -20dB to -16dB), no distortion.
Matching Degree
What happens if matching is poor?
Matching degree refers to the “impedance compatibility” between the antenna input port and the subsequent waveguide/feedline. Analogy: like connecting a水管 to a faucet, wrong interface size causes leakage; antenna impedance mismatch causes power to reflect back to the transmitter instead of radiating.
Example: A waveguide antenna designed without considering high-frequency matching; test finds S11 (reflection coefficient) @18GHz is -10dB (corresponding |S11|=0.1), meaning 10% power reflected back.
Transmitter outputs 10W, antenna only receives 9W, remaining 1W reflects within waveguide, potentially causing equipment heating or damage.
Design requires reflected power below 5% (|S11|≤-13dB), thus not up to standard.
How to measure matching degree?
Measure matching degree by measuring the S11 parameter, reflecting the magnitude of the port-reflected signal. Steps are clear:
- Equipment Prep: Use calibrated VNA, e.g., R&S ZNB40, freq range 10MHz-40GHz, accuracy sufficient for broadband waveguide antenna.
- Connect DUT: DUT antenna connected via waveguide (e.g., WR62, suited for 12-18GHz) to VNA Port 1, Port 2 connected to 50Ω matched load (VSWR <1.02, ensure clean reference plane).
- Set Sweep Parameters: Span set to target bandwidth (e.g., 12-18GHz), points set to 7 (12,13,14,15,16,17,18GHz), resolution bandwidth 100kHz (reduce noise).
- Read Data: VNA outputs S11 value (reflection coefficient) for each frequency point, convert to |S11| (dB) and VSWR.
Example Data (measured S11 for an antenna):
| Frequency (GHz) | S11 (dB) | VSWR | Reflected Power % |
|---|---|---|---|
| 12 | -18 | 1.2 | ~1% |
| 14 | -16 | 1.4 | ~2.5% |
| 16 | -14 | 1.6 | ~5% |
| 18 | -12 | 1.8 | ~10% |
Looking at this table, reflected power is below 5% from 12-16GHz, but rises to 10% @18GHz, indicating poor matching at high-frequency end.
What factors affect matching?
Matching degree is not fixed after antenna manufacture; structural choices during design, machining errors all affect it.
1. Waveguide Dimensions & Antenna Aperture
Waveguide broad wall ‘a’ and narrow wall ‘b’ determine internal wave impedance (TE10 mode impedance Z_TE10=377×(b/a)×(λ/λ_g)). If antenna aperture dimensions mismatch waveguide, e.g., aperture width much larger than waveguide, it’s like “thick pipe to thin pipe”, sudden impedance causes reflection.
Case: An antenna originally designed with waveguide broad wall a=1.5mm (WR62 standard), but machining resulted in a=1.6mm, causing S11 @15GHz to rise from -16dB to -13dB (reflected power increased from ~5% to ~10%).
2. Antenna Arm Length & Current Distribution
Length of radiating parts (e.g., dipole arm, waveguide opening length) affects surface current distribution.
If arm length not integer multiple of λ/4, current reflects at end, causing input impedance to deviate from 50Ω.
Test Comparison: Adjusting antenna arm length from 3.2mm (λ/4@15GHz) to 3.5mm, S11 @15GHz changed from -17dB to -14dB (reflected power increased from ~3% to ~6%).
3. Surface Treatment Process
Oxidation or contamination on waveguide inner wall increases conductor loss, altering surface impedance.
Tests show, non-gold-plated waveguide wall (resistivity 5×10⁻⁸Ω·m) compared to gold-plated (resistivity 1×10⁻⁸Ω·m) has S11 2dB higher @18GHz (reflected power doubles).
Can poor matching be fixed?
If testing reveals poor match, design adjustments can be remedied, most common is adding a stepped impedance transformer or tapered slot.
Improvement Case: An antenna had S11=-12dB @18GHz (10% reflected power).
A stepped waveguide section added between waveguide and antenna (broad wall tapered from 1.5mm to 1.6mm, length λ/4@18GHz).
Retest showed S11=-15dB @18GHz (~3% reflected power), significant matching improvement.