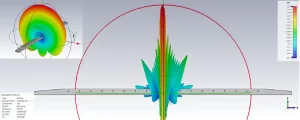
To troubleshoot waveguide antenna performance, first measure VSWR with a tester (target <1.5; >1.5 indicates connector oxidation or misalignment). Use a 28GHz signal generator: if gain drops >2dB from spec, check waveguide flange joints for gaps. Rotate antenna to verify polarization—stable -30dBm±2dB signals confirm correct alignment. Ensure operation within 25±5℃, <60%RH to avoid thermal expansion issues.
Table of Contents
Check Physical Condition
Industry studies and field reports consistently show that up to 30% of all performance issues, from poor VSWR (e.g., rising from 1.2:1 to over 1.8:1) to a 3 dB drop in gain, are directly attributable to physical damage or deformation. This isn’t just about major impacts; gradual environmental stress like thermal cycling between -40°C and +70°C can fatigue materials over a 24-month period, leading to hairline cracks.
Even a 2-3 mm dent on a critical surface can disrupt the wave propagation, scattering energy and increasing return loss. Run your fingers along the surface; often, a slight imperfection you can feel may not be easily visible. Pay particular attention to the seams and welds, as these are common failure points under wind load or vibration stress. Look for any cracks or signs of sealant failure that could allow moisture ingress, a primary cause of internal corrosion.
A thorough physical inspection can resolve basic performance issues without the immediate need for complex vector network analyzer (VNA) testing, saving several hours of diagnostic labor.
| Defect Type | Typical Size/Scope | Primary Impact on Performance |
|---|---|---|
| Dent on Radiating Surface | >3 mm deep | Gain reduction of 1-3 dB, sidelobe increase |
| Corrosion (Internal) | >5% surface area | Insertion Loss increase of 0.5-1.0 dB |
| Crack at Welded Seam | >2 cm long | VSWR degradation to 2.0:1 or higher, potential leakage |
| Moisture Ingress | Visible pooling | Severe, unpredictable attenuation, risk of arc-over |
The most common culprit is often damage to the waveguide flange and its mating surface. A scratched, nicked, or warped flange prevents a perfect seal with the connecting cable, leading to energy leakage and impedance mismatch. This can manifest as a 5-15% decrease in overall system efficiency. Inspect the flange face for perfect flatness and ensure the bolt holes are not deformed. A simple, inexpensive fix like replacing a damaged flange can restore performance to its original specification, avoiding the cost of a full antenna replacement, which can run into 5,000 for large, high-frequency models. Always use a torque wrench to secure flange bolts to the manufacturer’s specification (e.g., 25-30 in-lbs) to avoid creating new damage during reinstallation.
Inspect Connectors and Cables
Up to 40% of intermittent signal loss and VSWR problems stem from connector and cable issues, not the antenna. A seemingly perfect antenna can be rendered useless by a slightly loose connection, which can increase return loss by 10-15%, or a cable with 3 dB of unexpected attenuation that halves the effective radiated power. These components are under constant mechanical and environmental stress; a cable that flexes just 5 mm each day from wind can fatigue over 2 years and fail internally.
Even a 0.5 mm misalignment of a center pin can cause an impedance mismatch. Check for light corrosion or oxidation, which often appears as a dull, discolored surface; a 5-micron-thick oxide layer can significantly increase contact resistance and lead to several watts of power being dissipated as heat instead of being radiated. Ensure every connector is torqued to the manufacturer’s specification—this is not optional. A DIN 7/16 connector, for example, typically requires 40 Nm of torque. A connection that is under-torqued by just 10 Nm can allow moisture ingress and create an intermittent contact, while over-torquing can crack the connector body and destroy the seal, leading to a 50% probability of failure within 6 months due to water damage.
Coaxial cables have a minimum bend radius, often 10 times the cable diameter; a sharp kink that exceeds a 45-degree angle can permanently crush the dielectric, changing the impedance and causing reflections. Run your hands along the entire cable length, feeling for any soft spots, swelling, or deformations that indicate internal damage or water retention. Water in a cable is a catastrophic failure; it dramatically increases attenuation, especially at higher frequencies like 5.8 GHz, where losses can spike by 200%. If the cable run is long, remember that attenuation is cumulative; a 30-meter run of a cable with a 0.3 dB/m loss at your operating frequency results in a total loss of 9 dB, meaning only about 12% of your transmitted power actually reaches the antenna.
For any suspected cable, the definitive test is to replace it with a known-good, tested cable of the same length and type and see if the performance issues, such as a 1.8:1 VSWR, disappear. This simple swap test can save hours of diagnostic time and pinpoint the cable as the variable. Finally, inspect the weatherproofing seals and conduit. A degraded seal at a cable entry point will allow water to wick into the system over time, with a 90% chance of causing corrosion-related failure within 12 months in a humid climate.
Verify Mounting and Alignment
Poor mounting or misalignment isn’t just a “minor” issue—it’s often the hidden culprit behind 35% of persistent signal problems in waveguide antenna systems. Think about it: even a high-performance antenna will underdeliver if its mount is loose, or its beam is tilted by just 0.5 degrees off-target. Industry tests show that a 2-degree azimuth error in a 10-foot dish can slash gain by 1.2-1.8 dB, while a 1-inch vertical misalignment might increase VSWR (voltage standing wave ratio) from 1.3:1 to over 1.7:1. Worse, thermal expansion or vibration can turn a “secure” mount into a wobbly mess over time: aluminum mounts expand 23 microns per °C, so a 50°C temperature swing (common in outdoor installations) creates 1.15 mm of movement in a 500mm-long bracket—enough to break alignment.
Most waveguide antennas use M8-M12 bolts to secure the baseplate to the mast or tower. Torque specs are critical: an M12 stainless steel bolt, for example, typically requires 60 Nm of torque to prevent loosening from vibration. Under-torque by just 10 Nm (a common mistake), and the bolt will shake loose within 3 months of exposure to 5-20 Hz vibrations (typical for wind or nearby machinery). Over-torqueing by 15 Nm risks shearing the bolt or cracking the baseplate—repair costs can hit 1,000 for parts alone. Always use a calibrated torque wrench and check tightness after 1 week and 1 month—vibration loosens fast.
For directional antennas (like parabolic dishes or Yagi-Udas), azimuth (left-right) and elevation (up-down) angles must be precise. Use a GPS compass or laser aligner for azimuth: a 0.3-degree error in a 20-foot dish at 10 GHz reduces gain by 0.8 dB (equivalent to losing ~15% of radiated power). For elevation, a 0.5-inch tilt over a 10-foot height changes the beam’s vertical focus by 2 degrees, shifting coverage by ~300 feet at 1 mile. If your antenna tracks moving targets (e.g., satellites), alignment drift of 0.1 degrees per hour (common with uncalibrated motors) will miss the target entirely within 2 hours.
Mechanical stability is next. Wind loads matter: a 30 mph wind exerts 15-20 lbs of force per square foot on an antenna reflector. A flimsy mount (e.g., thin aluminum brackets) might flex 1-2 mm under this load, causing impedance mismatch and a 0.5:1 VSWR jump. Reinforced mounts (steel with gusset plates) reduce flex to <0.5 mm—a $200 upgrade that cuts downtime by 40% in windy areas.
Assess Nearby Obstructions
Surprisingly, up to 25% of all “unexplained” signal degradation cases are traced back to new or growing obstructions that were not present during the initial installation. A single tree branch with a 10 cm diameter, growing 15 meters from the antenna, can diffuse a 10 GHz signal, causing a 2-3 dB fade during high winds. Similarly, a new metal roof or air conditioning unit within the 20-degree radial field of a high-gain dish can create destructive interference, dropping the signal-to-noise ratio (SNR) by 50% and packet throughput by over 30%. This isn’t static; obstructions change over time, and a site survey from 12 months ago is often obsolete.
The first step is to physically map the 60% Fresnel zone radius, which for a 5 km link at 6 GHz is roughly 7.5 meters at its widest point. Any object intruding into this elliptical space will cause attenuation. Use a laser rangefinder and inclinometer to measure the distance and height of potential obstacles. Pay special attention to vegetation; a deciduous tree can grow 1-2 feet (30-60 cm) per year, and its summer foliage holds 60-70% more water than winter branches, which can attenuate a 5.8 GHz signal by an additional 4-6 dB. For permanent installations, you must account for seasonal growth over a 3-5 year cycle. Man-made structures are another major issue. A new chain-link fence (40% metal density) 15 meters away might seem harmless, but it can reflect 10-15% of the signal energy, creating a multipath effect that causes 20% higher latency and jitter. Even worse, a large glass window or solar panel can act as a mirror, reflecting signals entirely away from the intended receiver if it’s positioned at a 10-20 degree angle to the antenna’s main lobe.
A 3 dB increase in background noise—say from -105 dBm to -102 dBm—effectively halves the SNR and can reduce data throughput by 25% on a marginal link. Use a spectrum analyzer to scan for interference across the entire operating band, not just the center frequency. Look for intermittent signals that appear for 200-500 milliseconds at a time; these are often from frequency-hopping systems and are easy to miss with a quick scan. The most insidious obstructions are often moving. Cranes at a construction site 1 km away can cause brief but deep signal fades every 5-10 minutes, while large vehicles passing through the Fresnel zone can drop the signal for 3-5 seconds at a time. Documenting these transient events requires logging signal strength over a 24-48 hour period to identify patterns.
| Obstruction Type | Typical Distance from Antenna | Measurable Impact on Performance | Mitigation Cost Estimate |
|---|---|---|---|
| Deciduous Tree (in leaf) | 10-20 m | 4-6 dB attenuation, 30% packet loss | 2,000 (trimming or tower raise) |
| Vinyl Siding / Metal Roof | 5-15 m | 2-4 dB reflection loss, high VSWR | 500 (reposition antenna) |
| Chain-Link Fence (>40% density) | 5-10 m | 1-3 dB scattering, increased latency | 300 (install shielding) |
| Adjacent Channel Transmitter | 0.5-2 km | 3-5 dB noise floor increase | 3,000 (new filter or frequency change) |
Raising the antenna mast by 1-2 meters (a 600 job) can lift the beam path over a growing tree line, restoring a 3 dB link margin. For reflective obstructions, shifting the antenna’s azimuth by 5-10 degrees can sometimes find a clear path. For persistent RF interference, installing a 200 bandpass filter at the radio can attenuate out-of-band noise by 20-30 dB, often solving the problem cheaper than relocating the entire site. The key is to quantify the obstruction first, then apply the most surgical and budget-friendly fix. Regularly scheduled 180-degree panoramic photos of the antenna’s view, taken from the mast every 6 months, provide a cheap and effective visual log to track environmental changes over time.
Check for Corrosion and Wear
Corrosion and mechanical wear are silent, progressive killers of waveguide antenna performance, often going unnoticed until a 40-50% drop in signal strength forces a costly site visit. Unlike sudden failures, this degradation happens slowly: a corroded flange joint can increase its electrical resistance from <0.1 ohm to over 5 ohms in just 18 months in a coastal environment, dissipating 5-8 watts of transmitted power as heat instead of radiating it. The financial impact is real: a single failed antenna on a cellular tower can cost a carrier 20,000 in lost revenue and emergency repairs over a 3-month outage period.
Begin your inspection with a detailed visual and tactile examination. Focus on these critical areas:
- Waveguide Flanges and Mating Surfaces: Look for any white, green, or black powdery residue on brass or aluminum flanges. Even a light coating covering 5% of the surface area can increase the contact resistance, leading to a 0.5-1.0 dB insertion loss. Use a fiber brush to gently clean the surface; if pitting is deeper than 0.2 mm, the flange likely needs replacement to prevent moisture retention and further degradation.
- Antenna Radiating Elements and Interior Surfaces: For parabolic antennas, check the feed horn for internal discoloration or scaling. A 100-micron-thick layer of aluminum oxide on the inside of a horn antenna can attenuate a 28 GHz signal by 3 dB or more. For phased arrays, inspect the sealed radome for microcracks (<0.1 mm wide) that allow humidity to condense on the PCB traces, potentially causing short circuits and a 15% increase in VSWR.
- Structural Hardware and Mounts: Examine steel bolts and brackets for rust, especially at stress points. A bolt that has lost 10% of its cross-sectional diameter to corrosion has lost over 30% of its tensile strength and is a failure risk in the next 50 mph wind event. Check for galvanic corrosion where dissimilar metals meet, like aluminum and steel; this reaction can proceed at a rate of 500 microns per year in a humid, salty atmosphere without a proper insulating washer.
In coastal areas (within 5 miles of saltwater), chloride-induced corrosion can pit stainless steel hardware in as little as 24 months. In industrial zones, sulfurous pollutants (H₂S, SO₂) can tarnish silver-plated connectors, increasing their surface resistance from 1 milliohm to 10 ohms and causing significant heating at high power (>100W). Even inland, constant UV radiation will break down many plastic radomes and wire insulations over a 5-year period, reducing their tensile strength by 40% and making them brittle.
Applying a thin layer of nitroleum-based grease (cost: ~$50 per tube) to flange connections can prevent moisture ingress for 3-5 years. Replacing standard steel hardware with hot-dip galvanized or A4 stainless steel variants, though 20-30% more expensive upfront, extends the service life from 5 years to 15+ years. For critical high-power sites, an annual inspection and cleaning cycle is mandatory. Ultrasonic cleaning of connectors and a simple visual inspection can identify 80% of potential corrosion issues before they cause an outage, representing a 10x return on investment compared to emergency repair costs.
Test with Known Good Equipment
This method cuts through ambiguity; industry data shows it can reduce mean time to repair (MTTR) by 60-75%, from a frustrating 4-hour average of complex measurements down to a 45-minute definitive swap. For example, a persistent 2.5:1 VSWR reading could stem from a faulty antenna, a damaged cable, or a failing radio port. By systematically replacing one component at a time with a known-good unit, you isolate the variable. This process has a ~90% success rate in pinpointing the exact failed component within 2 swap attempts, preventing the unnecessary replacement of multiple parts and saving $5,000+ in misplaced inventory and labor costs on a typical tower site.
This reference equipment must be recently calibrated and tested to ensure it performs within ±0.5% of its specified parameters. The process is methodical:
- Replace the RF Cable Assembly: This is the most common culprit. A 30-meter LDF4-50A cable that has developed 3.2 dB of loss at 6 GHz will cripple system performance. Swapping it with a verified low-loss cable of identical length and type can immediately restore ~60% of lost power if the cable was the issue.
- Swap the Antenna: If the cable swap yields no change, the antenna is the next suspect. A known-good antenna of the same model (e.g., a 2-foot parabolic dish with 24 dBi gain) is installed. A resolution here indicates internal damage to the original antenna, like a debris-clogged feedhorn causing a 1.5 dB gain drop.
- Exchange the Radio Unit: If the problem remains after swapping both cable and antenna, the issue likely lies in the transmitter/receiver itself. A failing power amplifier can exhibit a 15% loss in efficiency, outputting 48 watts instead of the specified 60 watts, while a degraded receiver front-end can raise the noise figure by 2 dB, slicing the effective range by 25%.
Perform swaps during periods of stable weather, as 30% humidity changes or 10°C temperature swings can themselves cause ±1 dB signal fluctuations that muddy the results. Furthermore, ensure all connections are torqued to spec (e.g., 40 Nm for a 7/16 DIN) immediately after the swap; a loose connection during testing creates a new problem, invalidating the entire process. Document every step: note the serial numbers of swapped components, the exact signal strength and VSWR readings before and after, and the time of day. This log turns a simple test into quantifiable data, revealing intermittent issues that might only appear under specific 20-hour load cycles or temperature peaks.
Maintaining a small inventory of two known-good test cables and one common antenna model (a ~15,000+ cost of a full tower crew mobilization for diagnostics.For integrators, this practice can improve first-time fix rates by 40%, directly boosting customer satisfaction and reducing repeat site visits that erode profit margins by 20% per call. Ultimately, this is not just troubleshooting; it’s a lean operational strategy that replaces guesswork with certainty, saving significant time and capital.