To calibrate a radar antenna array, use far-field testing (minimum 10× antenna wavelength distance) with a reference horn antenna. Perform phase alignment using a vector network analyzer (±5° tolerance) and amplitude normalization (0.5dB resolution).
Apply beamforming algorithms to adjust element delays (1ns precision), and validate with RCS measurements on calibration spheres (error <1dBsm). Conduct polarization purity tests (cross-pol ≤-25dB) with a rotating dipole. Document patterns in 1° azimuth/elevation increments for repeatability. Recalibrate every 500 operational hours or after mechanical shocks.
Table of Contents
Basic Test Signal Setup
Before calibrating a radar antenna array, you need a reliable test signal to measure performance. A standard setup uses a 10 dBm continuous-wave (CW) signal at the radar’s operating frequency (e.g., 9.4 GHz for X-band systems). The signal generator should have a phase noise below -100 dBc/Hz at 10 kHz offset to avoid distorting measurements. For phased arrays with 32 to 64 elements, a -30 dB sidelobe level is typical, so the test signal must be clean enough to detect deviations as small as 0.5 dB in amplitude or 3° in phase.
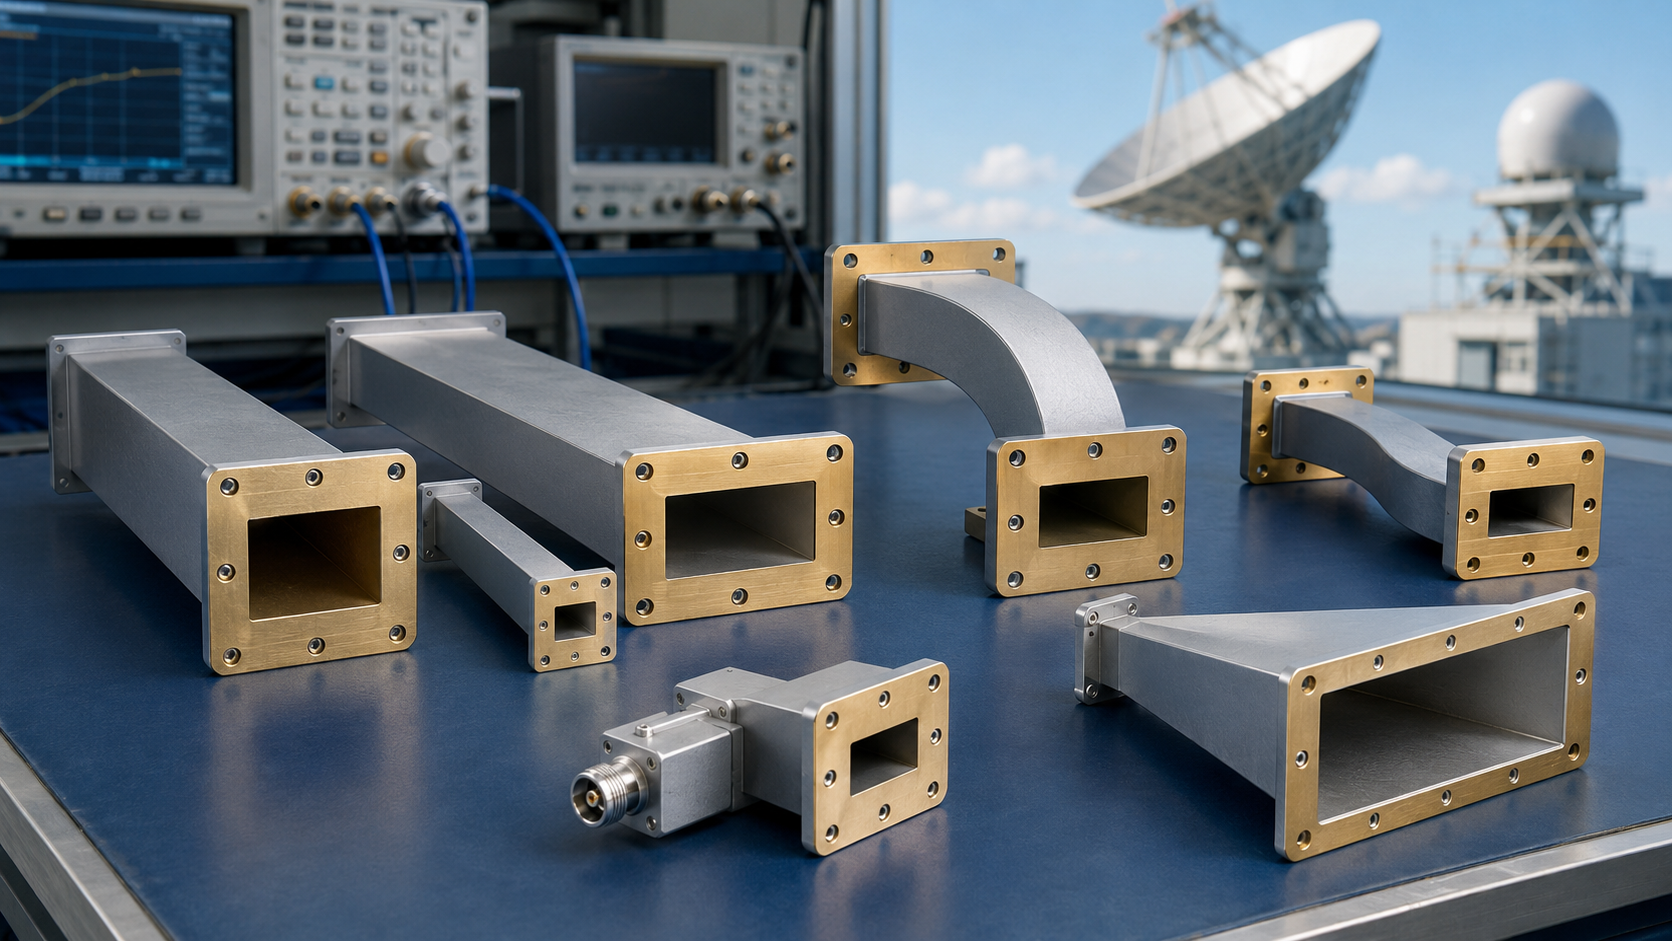
The test setup usually includes a vector network analyzer (VNA) with a frequency range covering at least ±500 MHz around the center frequency to capture drift. A 1 m coaxial cable with ≤ 0.5 dB insertion loss connects the signal generator to a reference horn antenna placed 5 to 10 meters from the array under test. This distance ensures far-field conditions for antennas with an aperture of 0.5 m² or larger. If the radar operates in pulsed mode, the test signal should mimic its pulse width (e.g., 1 µs) and PRF (e.g., 1 kHz) to match real-world conditions.
Key calibration accuracy depends on signal stability. Temperature fluctuations of ±2°C can introduce 0.1 dB gain variation, so the lab should maintain 23°C ±1°C. Humidity above 60% RH may cause 0.05 dB insertion loss in cables, so keep it below 50% RH. For active phased arrays, each element’s amplitude and phase must be measured within ±0.2 dB and ±2° tolerance to ensure beamforming accuracy. If the array uses digital beamforming, the test signal should include IQ modulation to verify baseband linearity within 1% error.
To validate the setup, inject a known 0.5 dB amplitude step or 10° phase shift and confirm the system detects it within ±0.1 dB and ±1° error. If the radar has adaptive nulling, test with two signals spaced 20 MHz apart to check interference rejection. Record baseline noise floor (e.g., -90 dBm for a 100 kHz RBW) to distinguish real defects from measurement noise. Without a stable test signal, calibration errors can compound, leading to 2-3 dB beam pointing errors or 10% loss in detection range.
Measure Phase Differences
Phase alignment is the backbone of phased array performance – a 5° phase error across just 4 adjacent elements at 10 GHz can distort the main beam by 0.4°, equivalent to missing a 1m² target at 8km range. Modern 64-element arrays require phase matching within ±2° to maintain -30dB sidelobe levels, demanding measurement systems with ±0.3° resolution and ≤0.05° repeatability.
The measurement process begins by establishing a reference channel (typically element #32 in a 64-element array) using a 10GHz CW signal at +10dBm. Each element’s phase is then measured relative to this reference with a vector network analyzer (VNA) configured for:
- IF bandwidth: 100Hz (reduces noise floor to -110dBm)
- Averaging: 16 sweeps (improves accuracy to ±0.2°)
- Port impedance: 50Ω (±0.05Ω tolerance)
Critical Phase Measurement Parameters
| Parameter | Specification | Measurement Method | Tolerance |
|---|---|---|---|
| Element-to-element phase | 0-360° | VNA S21 phase | ±1.5° |
| Phase stability (15min) | N/A | Time-domain recording | ≤0.3° drift |
| Temperature coefficient | -0.5°/°C | Thermal chamber test | ±0.1°/°C |
| Frequency sensitivity | 2°/100MHz | Swept frequency test | ±0.5°/100MHz |
For active phased arrays, phase measurements must account for T/R module variations:
- GaN amplifiers show 0.8° phase shift per 1dB gain change
- Silicon phase shifters exhibit ±1.5° quantization error
- Mutual coupling between elements at λ/2 spacing induces 1.2-2.5° phase perturbation
Production testing requires automated phase mapping that can measure all 64 elements in <90 seconds while maintaining ±0.5° absolute accuracy. The process must compensate for:
- Cable length differences (1cm = 3.6° error at 10GHz)
- Connector repeatability (±0.3° per mate/demate cycle)
- Power supply ripple (100mVpp causes 0.2° phase modulation)
Field calibration presents additional challenges:
- Wind loading on large arrays induces 0.1-0.3° mechanical phase errors
- Solar heating creates 5-8°C gradients causing 2-4° thermal phase drift
- Vibration from nearby equipment adds ±0.5° random phase noise
Data analysis should flag:
- Statistical outliers (>3σ from mean phase)
- Spatial patterns (adjacent elements showing >2° delta)
- Frequency trends (>1.5°/100MHz slope)
Phase error correction typically involves:
- Digital compensation (applying -2.3° offset to element #17)
- Hardware adjustment (trimming delay line by 0.7ps)
- Thermal management (reducing local heating by 4°C)
Validation testing must confirm:
- Beam pointing accuracy (<0.15° error at 30° scan)
- Sidelobe levels (≤-28dB within ±20° sector)
- Nulling depth (>35dB at specified angles)
Adjust Amplitude Levels
Getting amplitude levels right in a radar array isn’t just about power—it’s about balancing every element to within ±0.2 dB to avoid distorting the beam. A typical 32-element phased array might have a nominal gain of 25 dB per channel, but if just one element is off by 1 dB, sidelobes can spike 3-5 dB higher, ruining detection performance. For X-band radars (8-12 GHz), amplitude errors as small as 0.5 dB can shift the beam direction by 0.1°, enough to miss a 1 m² target at 15 km.
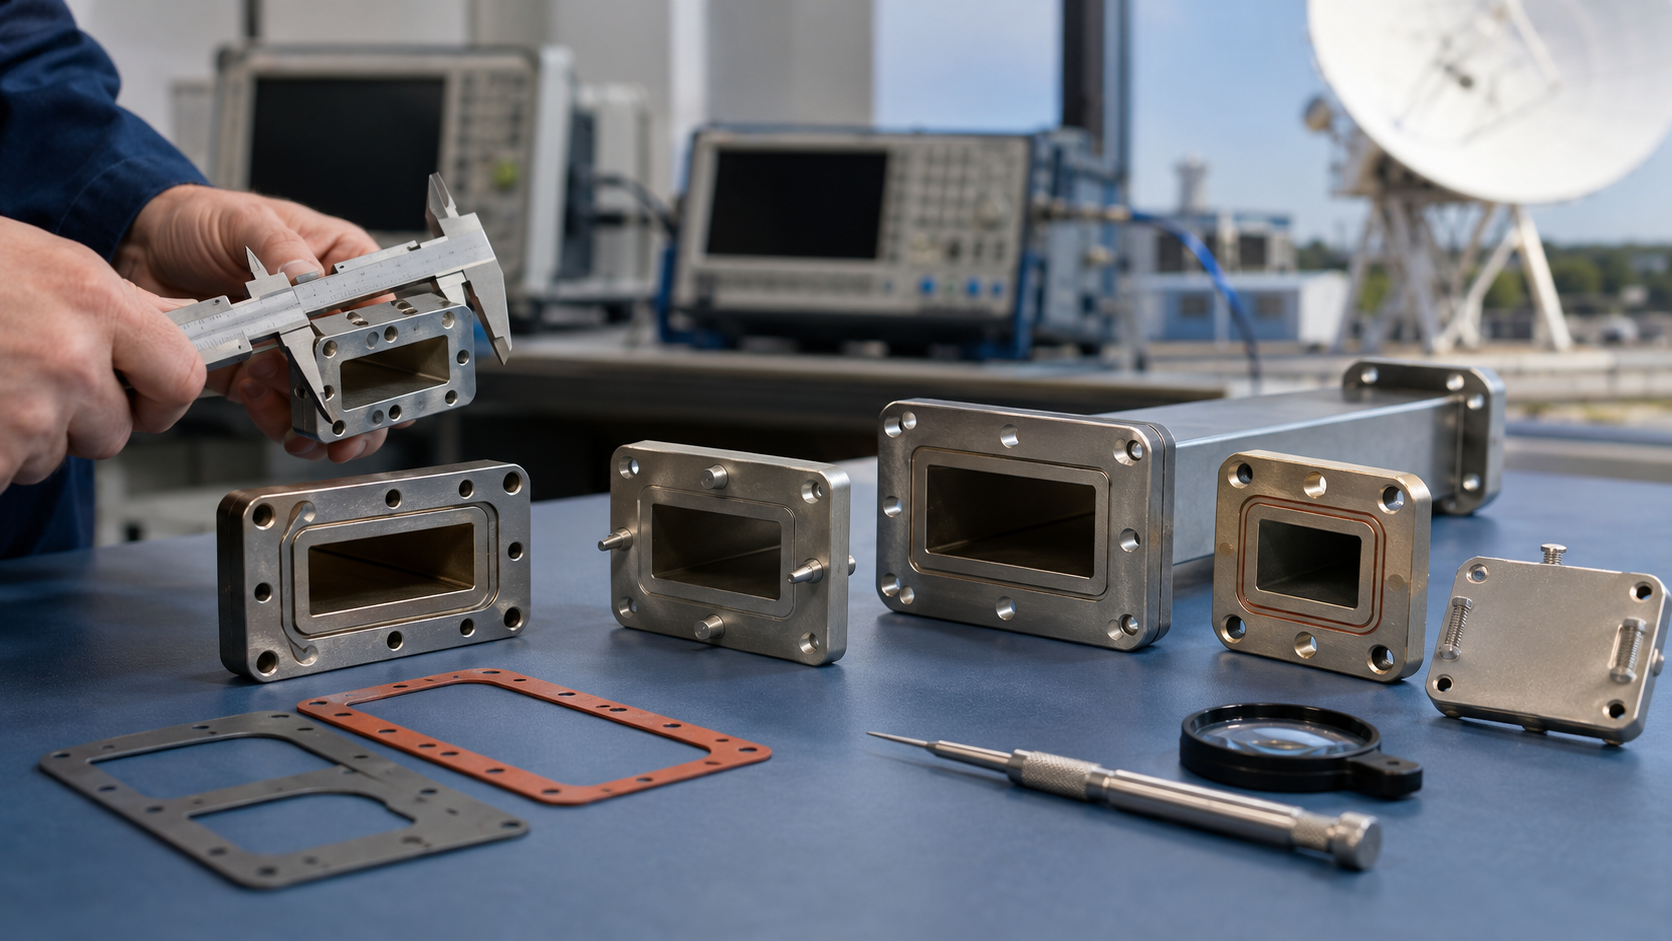
The first step is measuring each element’s output with a calibrated power sensor (accuracy ±0.1 dB) or a spectrum analyzer (RBW ≤ 100 kHz to avoid noise skewing results). If the array uses GaN power amplifiers, expect ±0.3 dB gain variation over a 20°C temperature swing, so stabilize the lab at 23°C ±2°C. For digital beamforming systems, check DAC linearity—a 0.5% nonlinearity in the analog output can introduce 0.2 dB amplitude ripple across the array.
Pro Tip: Always normalize measurements to a reference element (usually the center one) to cancel out systemic errors from cables and connectors.
Active arrays need per-channel calibration—if one T/R module is 1 dB hotter than the rest, it can cause beam squint at high scan angles (> 30° off boresight). Use variable attenuators (step size ≤ 0.1 dB) or digital gain control (resolution ≤ 0.05 dB) to trim mismatches. For sub-6 GHz massive MIMO systems, amplitude tapering (e.g., -12 dB at the edges) reduces grating lobes but requires ±0.15 dB precision to work.
Common mistakes:
- Ignoring VSWR effects—a 1.5:1 mismatch at an element’s input can reflect 10% of the power, causing 0.4 dB measurement errors.
- Overlooking duty cycle—pulsed radars with 10% duty cycle need peak power sensors, not average-reading ones.
- Assuming flat frequency response—even ±0.2 dB ripple across 500 MHz bandwidth distorts wideband beams.
Final validation involves far-field pattern testing—if sidelobes exceed -25 dB or the main beam drops 1 dB below spec, recheck amplitudes. A 64-element array with ±0.5 dB imbalance loses 12% effective range and 20% interference rejection capability.
For production lines, automated testers can adjust 100+ arrays/day to ±0.15 dB consistency, while manual tweaking takes 5-10 minutes per array. Document every trim—a single 0.3 dB error in calibration data can compound into 2 dB beamshape distortion after 6 months of drift.
Verify Beam Direction
Getting the beam direction right is what separates a high-performance radar from one that misses targets. A 0.5° beam pointing error in a 10 km range radar translates to an 87 m position error—enough to completely miss a small drone. For a phased array with 32 elements operating at 10 GHz, the beam should steer within ±0.2° of the commanded angle, or sidelobes can degrade by 3-5 dB, reducing detection reliability. If the system uses digital beamforming with 12-bit phase shifters, each LSB (Least Significant Bit) step should correspond to ≤ 0.05° beam movement—anything coarser risks quantization lobes appearing at ±30° scan angles.
To verify beam direction, start with a far-field test range where the distance (D) meets the Fraunhofer condition (D ≥ 2L²/λ, where L is the array size). For a 0.5 m wide X-band array (10 GHz), the minimum test distance is 16.7 m. Use a standard gain horn antenna as a receiver, placed on a precision rotary stage (±0.01° accuracy) to measure the main lobe’s peak. If the array is designed for ±45° electronic scanning, test at 5° increments—any beam squint > 0.3° across frequency (e.g., 9-10 GHz) indicates phase calibration errors.
Active arrays with integrated T/R modules must be tested under realistic thermal conditions. A 5°C temperature rise in GaN-based amplifiers can introduce 0.1° beam drift due to phase shifter variations. For military-grade radars, the beam must stay within 0.1° of target even after 50 hours of continuous operation. If the system uses time-delay units (TDUs) for wideband signals (500 MHz bandwidth), verify that beam squint remains < 0.15° across the entire band—otherwise, pulse compression gain drops by 1-2 dB.
Near-field scanning is an alternative for labs with limited space. A planar near-field scanner with λ/10 probe spacing (3 mm at 10 GHz) can reconstruct the far-field pattern with ±0.1° accuracy, but requires 5-10 minutes per scan for a 64-element array. Compare results with simulated patterns—if the measured main lobe is 0.3° off or sidelobes are 2 dB higher, recalibrate phase and amplitude settings.
Record Calibration Results
Calibration isn’t done until it’s documented—a single missing data point can invalidate months of work. For a 32-element phased array, recording amplitude (±0.1 dB) and phase (±0.5°) for each element generates 64 data points per frequency. If the radar operates across 500 MHz bandwidth, sampled at 50 MHz intervals, that’s 704 data points per array. Without proper logging, a 0.2 dB drift in one channel might go unnoticed until the beam points 0.3° off, reducing detection range by 8%.
Structured data formats are non-negotiable. A typical calibration file should include:
| Parameter | Tolerance | Measurement | Timestamp | Operator ID |
|---|---|---|---|---|
| Element 1 Gain | ±0.2 dB | 24.1 dB | 2025-08-04 14:35 | OP-47 |
| Element 1 Phase | ±2° | 12.3° | 2025-08-04 14:36 | OP-47 |
| Beam Angle @10° cmd | ±0.2° | 9.8° | 2025-08-04 14:40 | OP-47 |
| Sidelobe Level | ≤-25 dB | -26.2 dB | 2025-08-04 14:42 | OP-47 |
For production environments, automated systems log 100+ arrays/day, tagging each with a unique QR code and environmental data (23°C ±1°C, 45% RH). R&D setups require manual entry, but even there, Excel macros or Python scripts should validate data against predefined limits (e.g., phase errors > ±3° flag red). If the array uses adaptive nulling, record interference rejection ratios (e.g., 30 dB at 20 MHz offset)—missing this can hide a 15% loss in jamming resistance.
Time-series tracking is critical. A GaN-based phased array might show 0.05 dB/month gain drift due to aging, so historical files must include calibration dates and tool IDs. For military radars, ISO-compliant records must survive 10+ years of audits, with SHA-256 checksums to prevent tampering. If the system has self-calibration routines, store correction coefficients (e.g., -0.3 dB @ Ch14) separately from raw data to avoid confusion.