Losses in WR187 waveguides (8.2-12.4GHz, a=47.55mm, b=23.78mm) stem from conductor surface roughness (Ra>0.5μm adds 0.1-0.3dB/cm), dielectric oxidation (tanδ=1e-4 vs. 1e-6 clean, +0.02-0.05dB/cm), mode conversion at misaligned flanges (>λ/100, λ≈30mm at 10GHz, +0.1-0.3dB), and scattering from scratches (>λ/20, +0.05-0.15dB/cm).
Table of Contents
Wall Material Conductivity Impact
The conductivity of the wall material is a primary factor in determining the total loss of a WR187 waveguide. In practical terms, this loss manifests as attenuation, typically measured in decibels per meter (dB/m). For a standard WR187 waveguide (internal dimensions: 47.55 mm x 22.15 mm) operating at 5 GHz, the theoretical attenuation for a perfectly smooth, pure copper wall (conductivity σ ≈ 5.8×10⁷ S/m) is approximately 0.02 dB/m. However, real-world components rarely achieve this ideal.
A drop in material conductivity by just 10% can increase this attenuation by a similar proportion, pushing losses to around 0.022 dB/m. Over a 10-meter system run, this seemingly small difference adds up to 0.2 dB of extra loss, which can be critical for sensitive receiver systems or high-power transmission where every fractional dB lost converts into wasted energy and heat.
The fundamental physics behind this is straightforward: the waveguide walls carry currents, and any electrical resistance in the material converts some of the guided RF energy into heat. This is described by the surface resistance, , where is the frequency, is the permeability, and is the conductivity. This means losses are directly proportional to the square root of surface resistance. For instance, if you use aluminum (σ ≈ 3.8×10⁷ S/m) instead of copper, the surface resistance increases by roughly 22%, leading to a corresponding 22% increase in attenuation. This is a significant trade-off often made for weight reduction in aerospace applications, where the ~40% lower weight of aluminum might justify the ~0.005 dB/m higher loss.
While silver plating (σ ≈ 6.3×10⁷ S/m) offers about 4% lower loss than copper, its higher cost and tendency to tarnish make it impractical for most commercial systems. A more common issue is surface degradation. For example, a 2 µm layer of oxide or corrosion on a copper surface can drastically reduce effective conductivity at microwave frequencies, as the current concentrates within a skin depth of only about 1.33 µm at 5 GHz.
Copper Surface Roughness Effect
At microwave frequencies, current flows in an extremely thin layer—the skin depth—which is only about 1.33 µm at 5 GHz. If the surface roughness (Ra or RMS) is a significant fraction of this depth, the effective path length for the current increases dramatically, raising resistance and thus loss. For a WR187 waveguide, a standard milled copper interior with an Ra of 0.4 µm can see a 12% increase in attenuation compared to a theoretically perfectly smooth surface. This is not a marginal issue; it directly translates to a measurable drop in system efficiency and gain.
The physics behind this is modeled by the Hammerstad-Bekkadal formula, where the effective surface resistance increases by a factor . Here, is the RMS roughness and is the skin depth. This isn’t just theoretical. Measurements show that with an RMS roughness of 0.8 µm—common in extruded or poorly machined waveguides—the attenuation can skyrocket by 30% or more at 10 GHz, where the skin depth shrinks to just 0.66 µm.
| Surface Finish Type | Typical RMS Roughness (µm) | Estimated Loss Increase at 5 GHz | Process Cost (Relative to Milling) |
|---|---|---|---|
| Standard Milling | 0.3 – 0.5 | 10% – 15% | Baseline (1x) |
| Precision Polishing | < 0.1 | < 3% | 3x – 5x |
| Electroplating & Polish | < 0.05 | ~1% | 6x – 8x |
| As-Extruded | 0.7 – 1.2 | 25% – 50% | 0.7x |
For a high-power radar system operating at 2.5 MW, an extra 0.01 dB/m of loss from rough walls doesn’t just waste energy; it generates significant heat, potentially requiring a 5% larger cooling system. Conversely, for a sensitive satellite receiver, this added loss degrades the system noise figure directly. The frequency is the ultimate dictator of how careful you need to be. At 1 GHz, a roughness of 1 µm is less critical because the skin depth is a more forgiving 2.1 µm. But for 24 GHz applications, where the skin depth is a mere 0.42 µm, even a 0.2 µm RMS surface will cause a noticeable 8% increase in loss. Specifying an RMS surface roughness of less than 0.25 µm is often the most cost-effective way to minimize this loss mechanism without resorting to exotic polishing or plating techniques that can increase part cost by 400%.
Dielectric Material Loss Effects
While waveguides are primarily air-filled, the dielectric materials used in supporting structures—like center conductor insulators in pressurized lines or radome windows—introduce a measurable and often underestimated source of attenuation. This loss is quantified by the loss tangent (tan δ) of the material, a dimensionless parameter that directly scales with the amount of RF energy converted into heat. For a standard WR187 waveguide operating at 10 GHz, even a small 5 cm² PTFE (tan δ ≈ 0.0002) support window can add approximately 0.02 dB of insertion loss. However, if a lower-grade material like epoxy fiberglass (G-10, tan δ ≈ 0.02) is used for the same part, the loss skyrockets to over 2 dB, completely crippling the performance of a low-noise system. This makes the selection and minimization of dielectric materials a critical design choice.
The fundamental equation for dielectric loss is α_d ∝ ε_r’ * f * tan δ, where frequency (f) is the dominant multiplier. This means a material that is perfectly adequate at 2 GHz can become a major problem at 24 GHz. For instance, a 1 mm thick radome made of alumina ceramic (tan δ ≈ 0.0001) will have a negligible loss of 0.003 dB at 10 GHz. The same 1 mm thickness made of Rexolite (tan δ ≈ 0.0005) would incur about 0.015 dB of loss. But if a 5 mm thick polyethylene support (tan δ ≈ 0.001) is used in the same assembly, the loss jumps to 0.08 dB, which can be significant in a long chain of components. The cumulative effect of multiple dielectric supports is a key reason why system-level loss often exceeds the sum of individual waveguide section losses.
| Material | Relative Permittivity (ε_r) | Loss Tangent (tan δ) @ 10 GHz | Cost per cm³ (Relative to Air) |
|---|---|---|---|
| Air | 1.0 | 0.0 | Baseline (1x) |
| PTFE (Teflon) | 2.1 | 0.0002 | 8x |
| Polyethylene | 2.3 | 0.001 | 5x |
| Epoxy Glass (FR4) | 4.6 | 0.02 | 3x |
| Alumina Ceramic (99.5%) | 9.8 | 0.0001 | 25x |
Many common polymers like Nylon (tan δ ≈ 0.06) can absorb up to 8% of their weight in water, which has a very high tan δ (~0.16). This can increase the loss of a Nylon support by over 300% in high-humidity environments, effectively ruining the performance stability of an outdoor antenna system. The most cost-effective approach is to minimize the amount of dielectric material used. Instead of a large solid support, a design with three small 1 mm diameter PTFE pins (total volume ~0.03 cm³) will have over 90% less dielectric loss than a single large 1 cm³ block.
For pressurized waveguides, the pressure itself (2-3 PSI of dry air) can help suppress internal arcing, allowing for even smaller and less lossy dielectric supports. Always specify the exact material grade from your supplier; a generic “plastic” spec can lead to a 10x increase in loss from an inappropriate material choice.
Waveguide Dimension Tolerances
For a WR187 waveguide, the theoretical cutoff frequency for the dominant TE10 mode is calculated based on the broadwall width (a = 47.55 mm) to be approximately 3.15 GHz. However, a manufacturing tolerance of just ±0.10 mm on this width shifts the actual cutoff frequency by about ±6.5 MHz. While this seems small, in a tightly tuned system, this variance can lead to unexpected performance roll-off at band edges. More critically, dimensional errors change the surface current distribution, which increases resistive loss. A 1% decrease in the intended broadwall width can lead to a 2-3% increase in attenuation due to higher current density.
The impact of tolerances manifests in three primary ways:
- Frequency Shift: As above, a change in ‘a’ dimension moves the cutoff frequency, effectively shifting the entire usable band.
- Impedance Mismatch: A flange connection between two waveguides with a 0.05 mm difference in their ‘a’ dimensions can create a VSWR of 1.15:1 or higher. In a chain of ten such connections, the cumulative mismatch loss can easily exceed 0.4 dB, which is a substantial hit to system gain.
- Higher-Order Modes: Dimensional inaccuracies, especially twists or non-uniformity in the cross-section, can excite higher-order modes like TE20. For a waveguide that is 0.2 mm wider than specified, the potential for mode conversion loss increases by roughly 15% at frequencies above 8 GHz. This converted energy is then lost as heat within the waveguide, reducing transmission efficiency.
Holding a standard milled aluminum waveguide to a ±0.05 mm tolerance might increase its unit cost by 20% compared to a ±0.15 mm part. However, for a critical 38 GHz link budget, that investment is mandatory, as a 0.03 mm error at that frequency represents a much larger electrical fraction of the wavelength and can induce an additional 0.1 dB/m loss. The most problematic errors are often not the average size but the local deviations. A dent or bulge with a depth of 0.3 mm over a 5 cm length acts as a reactive discontinuity, reflecting 0.5% of the incident power.
For a high-power 50 kW system, that reflected power is 250 W that must be dissipated, creating a local hot spot and a potential single point of failure. Always specify the tolerance band required for your operating frequency and power level; assuming a standard mechanical tolerance is electrically sufficient is a common design mistake. Inspection of first-article units with a coordinate measuring machine (CMM) is worth the 1000 per unit audit cost to avoid a full production run of unusable components.
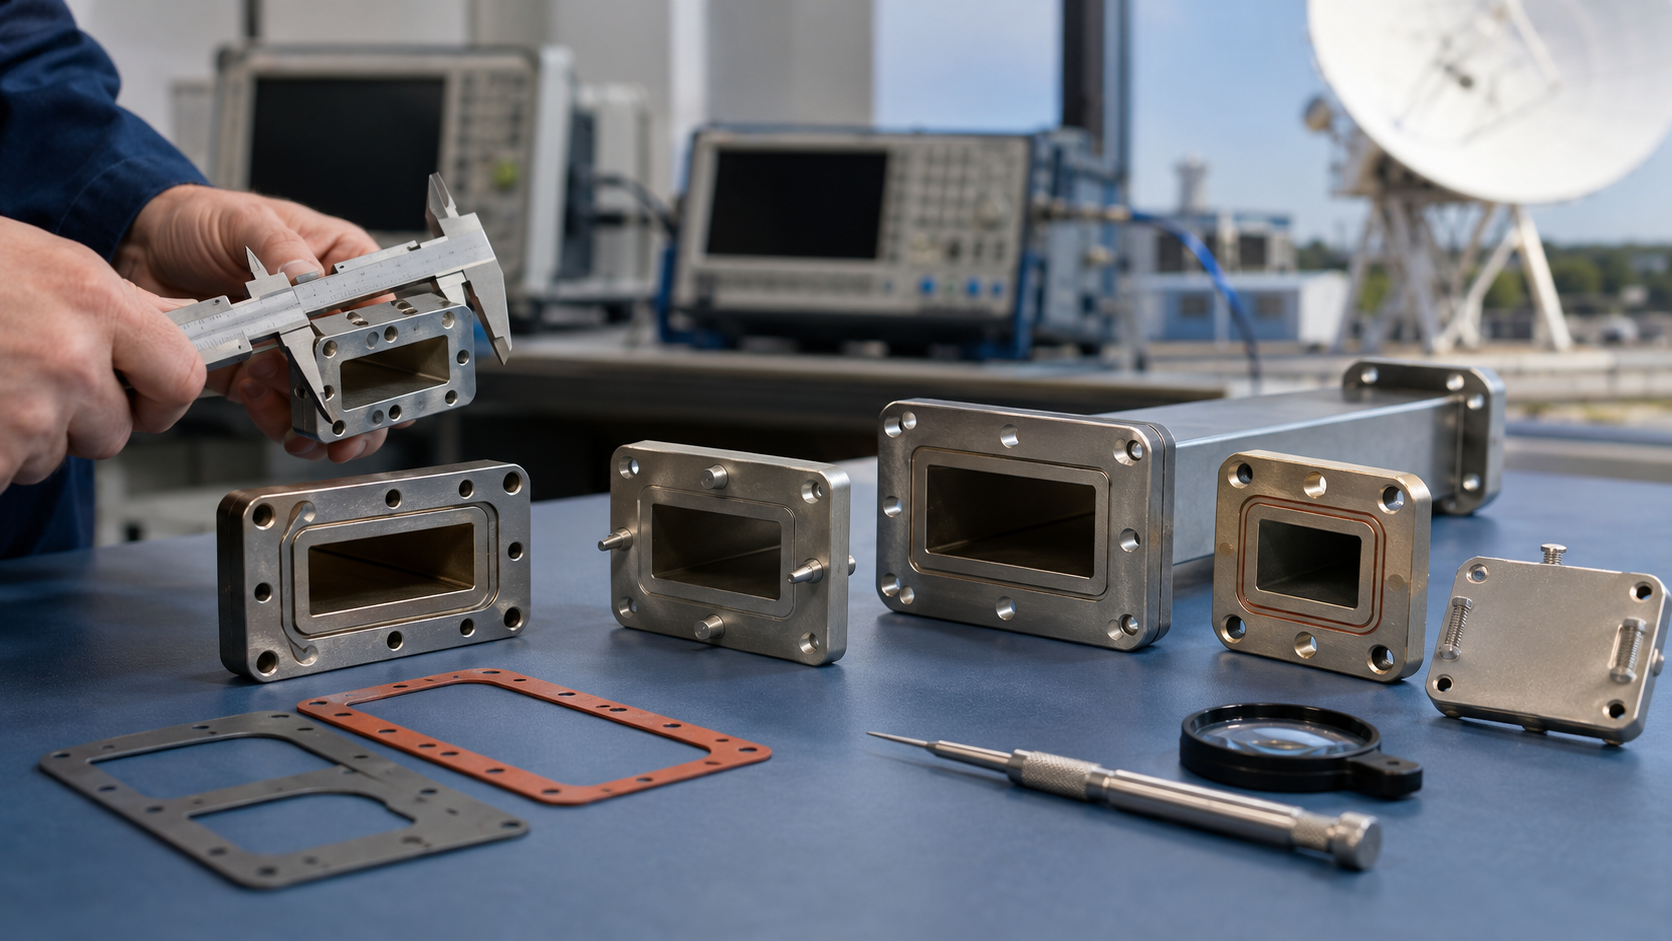
Improper Flange Connection Issues
For a standard WR187 operating in the 4-8 GHz range, a properly mated flange pair should introduce less than 0.03 dB of insertion loss and a VSWR better than 1.05:1. However, common installation errors can degrade this performance dramatically. A microscopic gap of just 0.05 mm between flanges can cause a 0.2 dB loss and a VSWR spike to 1.30:1 at 6 GHz, effectively creating a noticeable impedance discontinuity that reflects 1.7% of the transmitted power back towards the source. In a system with ten such connections, this translates to a cumulative loss of over 2 dB and a potential stability risk for the transmitter.
The primary failure modes at a flange interface are mechanical and often invisible to the naked eye:
- Gaps and Parallelism Errors: A non-uniform gap, even if the average separation is zero, creates a capacitive effect. A tilt error of 0.5 degrees between two flanges is enough to generate a VSWR of 1.25:1.
- Surface Damage: A single dent or scratch deeper than 0.01 mm on the sealing surface can disrupt current flow, increasing local resistance and loss by 5-10% at that specific point.
- Incorrect Bolt Torque: The torque sequence and value are critical. Under-tightening (below 2.3 N·m) leaves a gap, while over-tightening (above 3.5 N·m) can warp the flange, creating a permanent distortion. A 20% deviation from the specified torque can lead to a 0.1 dB increase in loss per connection.
- Contamination: A dust particle with a diameter of 0.1 mm trapped between the surfaces acts as a small capacitor, but a conductive contaminant like metal shavings can short the currents, creating localized heating and loss spikes.
Diagnosing a single faulty flange connection in a fielded system can require 4-6 hours of technician time, a spectrum analyzer, and a VNA, costing upwards of 800 in labor and equipment fees. This is entirely preventable with proper procedures. Using a feeler gauge to verify a gap of less than 0.02 mm and a torque wrench set to 2.8 N⋅m during assembly is a minimal upfront cost that prevents massive downstream losses.
For critical high-power systems operating above 10 kW, the reflected power from a single poor connection can exceed the 100 W rating of a load isolator, triggering a system shutdown. The use of alignment pins is non-negotiable for frequencies above 18 GHz; without them, the inherent play in bolt holes guarantees a misalignment that can consume over 30 1200, pays for itself after preventing the scrapping of a single $5000 antenna feed assembly due to poor VSWR.
Waveguide Wall Oxidation Influence
The skin depth for copper at 10 GHz is approximately 0.66 µm. A copper oxide (Cu₂O) layer with a thickness of just 0.5 µm possesses an electrical conductivity that is ten million times lower than that of pure copper (σ ≈ 10⁻⁴ S/m vs. 5.8×10⁷ S/m). This forces the RF current to travel through a higher resistance path, dramatically increasing attenuation. For a WR187 waveguide, this can mean the difference between a design spec of 0.04 dB/m and a real-world, oxidized loss of 0.08 dB/m or higher after several years of operation in a humid environment, effectively halving the system’s efficiency.
The rate of oxidation and its impact are governed by a few key variables:
- Relative Humidity: This is the primary accelerator. At 85% relative humidity and 30°C, a bare copper surface can develop a 0.1 µm oxide layer in under 6 months. This layer can increase attenuation by 8% at 5 GHz.
- Temperature: A 10°C increase in operating temperature can double the oxidation rate, reducing the time to reach a critical loss threshold by 50%.
- Chemical Exposure: Trace amounts of sulfur or chlorine in the atmosphere (as low as 50 ppb) can form sulfate or chloride films, which are even more resistive than oxide and can triple the loss increase for a given film thickness.
The only effective strategy is a protective barrier. The choice of plating is a direct trade-off between performance, durability, and cost.
| Coating Type | Typical Thickness | Estimated Conductivity (S/m) | Performance Impact (vs. Bare Cu) | Relative Cost (5-year lifecycle) |
|---|---|---|---|---|
| Bare Copper | N/A | 5.8×10⁷ | Baseline (degrades rapidly) | 1x (but high risk) |
| Silver Plating | 3 – 5 µm | 6.3×10⁷ | -3% to -5% (improvement) | 2.5x |
| Gold Plating | 1 – 2 µm | 4.5×10⁷ | +15% (higher initial loss) | 6x |
| Electroless Nickel | 3 – 8 µm | 1.4×10⁷ | +40% (significant loss) | 1.8x |
Despite a 150% upfront cost increase over bare copper, it maintains its conductivity over time and prevents the massive performance drop from oxidation. A 4 µm silver plate will typically last over 15 years in a controlled environment, maintaining the loss within 2% of its initial value. The alternative—using unplated copper and accepting the 0.5 dB additional loss per 10 meters after five years—often costs more in system downtime and reduced range than the initial plating investment.
For internal systems with stable, temperature-controlled, and dry air (e.g., <30% RH), bare copper might be viable, but this requires a commitment to periodic inspection and cleaning with solvents to remove any early-stage tarnish every 12-18 months. For any external or maritime application, plating is not an option but a requirement; the salt spray in a coastal environment can degrade a bare copper waveguide to the point of failure in under 3 years.