Selection depends on matching the frequency (e.g., 2-40 GHz), ensuring gain error < ±0.5 dB and VSWR < 1.3.
Table of Contents
Understanding Frequency
Each horn antenna corresponds to a specific WR waveguide standard; for example, WR-28 covers 26.5 to 40 GHz, with internal waveguide dimensions of 7.112 mm x 3.556 mm.
The frequency level directly relates to the antenna’s aperture size and signal gain. At different frequency points such as 24 GHz or 60 GHz, the free-space path loss varies significantly.
Selection must align with IEEE frequency divisions, ensuring that the Voltage Standing Wave Ratio (VSWR) remains below 1.25:1 across the entire band to meet the quantification accuracy requirements of the test system.
Bands and WR Standards
The numbers in the WR designation represent the internal wide-wall dimension of the waveguide in hundredths of an inch; for example, the internal wide-wall width of WR-90 is 0.900 inches (22.86 mm).
In electromagnetic wave transmission, the dimensions of a rectangular waveguide directly limit the lowest frequency that can pass through, known as the cutoff frequency of the TE10 mode.
For WR-90, the theoretical cutoff frequency is 6.557 GHz, but to ensure single-mode characteristics of signal transmission and avoid high-dispersion regions, the actual recommended operating range is strictly limited to between 8.20 GHz and 12.40 GHz.
This frequency range setting follows the industry practice where the lower frequency limit is approximately 1.25 times the cutoff frequency, and the upper limit is approximately 1.9 times the cutoff frequency.
When operating below this range, massive attenuation occurs within the waveguide; when operating above this range, higher-order modes such as TE20 or TE01 appear, leading to severe distortion of the horn antenna’s radiation pattern, increased sidelobe levels, and loss of reference value for gain calibration.
In the field of global microwave and millimeter-wave measurement, standard divisions usually refer to IEEE or MIL-SPEC specifications.
The table below details the WR specifications corresponding to mainstream standard gain horn antennas from microwave to millimeter-wave bands, along with their precise physical and electrical performance data.
| Waveguide Standard (WR) | Corresponding Band Name | Frequency Range (GHz) | Internal Dimensions (Inch) | Internal Dimensions (mm) | Cutoff Frequency (GHz) |
|---|---|---|---|---|---|
| WR-137 | C Band | 5.85 – 8.20 | 1.372 x 0.622 | 34.85 x 15.80 | 4.301 |
| WR-112 | X Band | 7.05 – 10.00 | 1.122 x 0.497 | 28.50 x 12.62 | 5.260 |
| WR-90 | X Band | 8.20 – 12.40 | 0.900 x 0.400 | 22.86 x 10.16 | 6.557 |
| WR-75 | Ku Band | 10.00 – 15.00 | 0.750 x 0.375 | 19.05 x 9.53 | 7.869 |
| WR-62 | Ku Band | 12.40 – 18.00 | 0.622 x 0.311 | 15.80 x 7.90 | 9.488 |
| WR-51 | K Band | 15.00 – 22.00 | 0.510 x 0.255 | 12.95 x 6.48 | 11.570 |
| WR-42 | K Band | 18.00 – 26.50 | 0.420 x 0.170 | 10.67 x 4.32 | 14.047 |
| WR-34 | Ka Band | 22.00 – 33.00 | 0.340 x 0.170 | 8.64 x 4.32 | 17.353 |
| WR-28 | Ka Band | 26.50 – 40.00 | 0.280 x 0.140 | 7.11 x 3.56 | 21.071 |
| WR-22 | Q Band | 33.00 – 50.00 | 0.224 x 0.112 | 5.69 x 2.84 | 26.346 |
| WR-19 | U Band | 40.00 – 60.00 | 0.188 x 0.094 | 4.78 x 2.39 | 31.391 |
| WR-15 | V Band | 50.00 – 75.00 | 0.148 x 0.074 | 3.76 x 1.88 | 39.875 |
| WR-12 | E Band | 60.00 – 90.00 | 0.122 x 0.061 | 3.10 x 1.55 | 48.354 |
| WR-10 | W Band | 75.00 – 110.00 | 0.100 x 0.050 | 2.54 x 1.27 | 59.015 |
In millimeter-wave radar testing, such as automotive radar calibration from 76 GHz to 81 GHz, a WR-12 specification horn antenna is typically chosen.
Although the coverage of WR-12 extends to 90 GHz, the antenna’s gain flatness performance is more stable at the 77 GHz frequency point, with fluctuations usually controlled within 0.2 dB.
For 6G communication research in even higher frequency bands, WR-5 or even WR-3 specifications are often used in laboratories, pushing frequencies into the 220 GHz to 330 GHz range.
At these extremely high frequencies, the internal dimensions of the waveguide shrink to below 0.86 mm x 0.43 mm, where even tiny physical deformations can lead to drastic changes in impedance characteristics.
In the X-band or Ku-band, due to the larger waveguide size, aluminum alloy stretch forming or plate welding processes are usually employed, with surfaces coated with anti-corrosion paint or subjected to conductive oxidation treatment.
However, upon entering the V-band (50-75 GHz), the skin depth decreases significantly, and electromagnetic waves propagate only in an extremely thin surface layer.
At this stage, Oxygen-Free High Conductivity (OFHC) copper is typically required, with the inner walls electroplated with gold or silver at a thickness of no less than 2.5 microns to reduce insertion loss caused by surface resistance.
In W-band testing at 110 GHz, because the waveguide aperture is extremely small, manufacturing tolerances must be strictly controlled within plus or minus 0.01 mm.
Any minor step at the flange connection will produce significant reflections, causing the VSWR to rise from an ideal 1.10 to above 1.50, thereby increasing measurement uncertainty.
In the transition areas between bands, such as 18 GHz or 26.5 GHz, selection personnel often face a choice between overlapping frequency bands.
Taking 18 GHz as an example, both WR-62 and WR-42 can cover this frequency point. WR-62 is at its upper frequency limit at 18 GHz, where waveguide dispersion is small and group delay is relatively stable.
Conversely, WR-42 is at its lower frequency limit at 18 GHz, close to the cutoff frequency, where the waveguide wavelength increases significantly and internal losses in the antenna are relatively high.
Laboratory testing experience shows that at band overlaps, choosing a horn antenna whose operating frequency is in the middle of its recommended range allows for better gain linearity and a wider clean operating bandwidth.
Under atmospheric pressure, the theoretical breakdown power of WR-90 waveguide at 10 GHz can reach several hundred kilowatts; however, as frequency increases and WR size decreases, the power capacity drops exponentially.
By the WR-10 band, because the electric field intensity rapidly concentrates in a tiny space, continuous wave power is usually limited to within 100 watts to prevent antenna structure deformation caused by heat accumulation.
The table below shows the theoretical attenuation data for different WR specifications under typical materials, reflecting the quantitative impact of rising frequency on link loss:
| WR Specification | Frequency (GHz) | Material | Theoretical Attenuation (dB/m) | Peak Power Capacity (kW) |
|---|---|---|---|---|
| WR-90 | 10.0 | Aluminum Alloy | 0.11 | 480 |
| WR-62 | 15.0 | Silver-plated Copper | 0.18 | 220 |
| WR-42 | 20.0 | Gold-plated Copper | 0.35 | 110 |
| WR-28 | 35.0 | Gold-plated Copper | 0.65 | 45 |
| WR-15 | 60.0 | Gold-plated Copper | 1.80 | 12 |
| WR-10 | 94.0 | Gold-plated Copper | 3.20 | 4 |
Through a deep understanding of frequency bands and WR specifications, it becomes evident that frequency is not just an electrical parameter; it defines the physical form of the test system through waveguide standards.
When performing system integration, one must ensure that the horn antenna’s flange type (such as UG-387/U or UBR100) matches the system feeder perfectly.
In millimeter-wave testing, even within the same band, there may be micron-level differences in flange pin hole positions under different national standards. This physical incompatibility can directly lead to unresolvable mismatch errors in gain measurements.
Physical Dimensions
In low-frequency bands such as the L-band (1 GHz to 2 GHz), to achieve a standard gain of 20 dBi, the horn aperture size usually needs to reach over 500 mm x 380 mm, with a total length often exceeding 700 mm.
As the frequency rises to the W-band (75 GHz to 110 GHz), under the same gain requirement, the aperture size dramatically shrinks to around 20 mm x 15 mm, with a length of only 40 mm.
This change in size is not arbitrary but is determined by the diffusion laws of electromagnetic waves in free space.
The design of the physical length must ensure that when the electromagnetic wave reaches the horn aperture plane from the waveguide mouth, the phase error is controlled within one-eighth of a wavelength. If the flare angle is increased to shorten the size, it will lead to an uneven phase distribution on the aperture surface, directly causing a decrease in gain and an increase in sidelobe levels.
The table below lists the typical physical parameters of standard gain horn antennas of different WR specifications under a 20 dBi gain setting, reflecting the quantitative constraints of frequency on antenna volume:
| Waveguide Spec (WR) | Frequency Range (GHz) | Aperture Width (mm) | Aperture Height (mm) | Total Horn Length (mm) | Typical Weight (g) |
|---|---|---|---|---|---|
| WR-284 | 2.60 – 3.95 | 520.5 | 385.2 | 850.0 | 12500 |
| WR-187 | 3.95 – 5.85 | 345.8 | 255.4 | 560.0 | 8200 |
| WR-90 | 8.20 – 12.40 | 125.5 | 92.3 | 210.0 | 450 |
| WR-62 | 12.40 – 18.00 | 82.1 | 60.4 | 145.0 | 280 |
| WR-42 | 18.00 – 26.50 | 58.6 | 43.1 | 110.0 | 150 |
| WR-28 | 26.50 – 40.00 | 38.5 | 28.3 | 75.0 | 85 |
| WR-15 | 50.00 – 75.00 | 20.2 | 14.8 | 48.0 | 40 |
| WR-10 | 75.00 – 110.0 | 14.1 | 10.4 | 35.0 | 25 |
In structural design, wall thickness is an important indicator for maintaining mechanical strength and precision.
For antennas above the X-band (WR-90), aluminum alloy plates of 2.0 mm to 3.0 mm are typically used.
In millimeter-wave bands above 40 GHz, to cope with extremely small waveguide dimensions, the antenna body is often manufactured using monolithic CNC precision machining or electroforming processes.
Since the skin depth of millimeter waves is extremely shallow—for example, only about 0.2 microns for copper at 100 GHz—the physical surface roughness of the antenna’s inner walls must be better than 0.4 microns.
Any tiny scratch or protrusion difficult to detect with the naked eye is equivalent to a significant proportion of the wavelength in physical size, causing electromagnetic wave scattering, increasing insertion loss, and destroying the symmetry of the radiation pattern.
The higher the gain, the larger the required physical dimensions. At the same frequency band, the aperture area of a 25 dBi horn is approximately 10 times that of a 15 dBi horn. When setting up a laboratory test environment, sufficient space must be reserved to meet the far-field test distance requirements.
The flange acts as the benchmark for physical connection, and its dimensional standards are highly unified worldwide.
For WR-28 and below, common flange types include UG-599/U or Square Flange;
In the millimeter-wave band (such as WR-10), the circular UG-387/U flange is used uniformly.
The diameter, bolt hole positions, and pin hole position tolerances of these flanges are usually required to be controlled at the 0.01 mm level.
During the physical assembly process, if the pin hole has a minor position offset, it will cause a step in the waveguide aperture at the connection.
This physical discontinuity generates reflections, causing the VSWR to rise from an ideal 1.10 to above 1.40, rendering calibration data invalid.
In the testing of large-aperture horns for satellite ground stations, aluminum alloy is the preferred choice due to its density of only 2.7 grams per cubic centimeter.
However, in metrology laboratories pursuing extreme precision, oxygen-free copper (density 8.96 g/cm³) is usually selected and gold-plated on the surface.
Although this significantly increases the weight of the antenna, copper has a lower coefficient of thermal expansion and can maintain more stable physical dimensions under different ambient temperatures, thereby ensuring long-term consistency in gain values.
For large antennas like the WR-284, its physical load of over 12 kg requires use with a heavy-duty non-metallic turntable to prevent interference from metallic brackets on the antenna’s backlobe radiation.
The phase center of a horn antenna is not fixed at the aperture plane but is located at a certain distance behind it. This physical distance changes with frequency. When performing precise path loss calculations, the phase center, rather than the aperture surface, must be used as the starting point for distance measurement.
In terms of processing technology, the “throat” of the standard gain horn—the area where the waveguide tube connects to the horn cone—is where physical dimension control is most rigorous.
Impedance transformation here is very sharp, and any R-angles or burrs left from processing will cause oscillations in electromagnetic waves.
In antennas of WR-15 or smaller specifications, the physical size accuracy of the throat directly limits the VSWR performance across the entire band.
Modern manufacturing technologies often use wire electrical discharge machining (WEDM) or high-precision EDM to ensure the geometry of this transition area perfectly matches the theoretical design.
For terahertz bands above 110 GHz, antennas even need to be manufactured via silicon-based Micro-Electro-Mechanical Systems (MEMS) technology to achieve micron-level physical dimension control.
The physical morphology of the antenna also includes external stiffener designs. For large horns, to prevent deformation during handling or installation, reinforcing ribs are usually welded onto the outside of the horn walls.
A minor physical deformation—for example, a 1% change in aperture width—might only cause a 0.1 dB gain change in the X-band, but in the Ka-band, it could lead to a gain offset exceeding 0.5 dB.
This physical span from centimeters to millimeters means that the selection of standard gain horn antennas must closely integrate laboratory physical space constraints, the load-bearing capacity of brackets, and the physical flexibility of connecting cables.
When building a 6G test platform, because the physical dimensions of WR-5 or WR-3 specification antennas are extremely small and fragile, they usually need to be paired with precision displacement stages and anti-vibration optical tables to avoid phase jumps caused by physical vibrations on micron-level alignment.
Signal Mode Distribution
In rectangular waveguides, electromagnetic waves exist in specific spatial distribution forms known as modes.
For standard gain horn antennas, the most ideal operating state is to maintain a single primary mode, specifically the TE10 mode.
Under the WR-90 waveguide standard, the wide-wall dimension is 22.86 mm, which sets the starting frequency of the TE10 mode. When the signal frequency is higher than 6.557 GHz, electromagnetic waves begin to propagate within the waveguide.
However, approaching this lower limit, the group velocity within the waveguide decreases significantly, while the phase velocity tends toward infinity, resulting in extremely low energy transmission efficiency and making impedance matching exceptionally difficult.
To ensure the repeatability of test data, the industry typically chooses to start usage above 1.25 times the theoretical cutoff frequency; for example, the actual operating starting point for WR-90 is set at 8.20 GHz.
At this point, the electric field inside the waveguide is primarily concentrated in the center of the wide wall and distributed along the narrow wall direction, forming a stable radiation source.
If the input frequency continues to rise and exceeds a specific limit, the waveguide will no longer maintain only the TE10 mode but will begin to allow higher-order modes, such as the TE20 mode.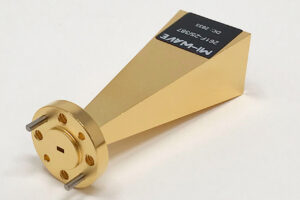
For any rectangular waveguide, the cutoff frequency of the TE20 mode is exactly twice that of the TE10 mode.
Taking the WR-42 waveguide as an example, its TE10 cutoff frequency is 14.047 GHz; before the frequency reaches 28.094 GHz, only the single primary mode can exist inside the waveguide.
Once the frequency breaks this threshold, the electromagnetic field produces two half-wave variations along the wide-wall direction of the waveguide, causing a severe distortion of the phase distribution on the horn aperture.
This mode switching produces a series of observable performance degradations, including the splitting of the radiation pattern’s main lobe and a large offset of the phase center.
In precise antenna gain measurement, if the operating frequency enters the higher-order mode region, the gain calibration value will produce drastic fluctuations exceeding 3 dB, causing the antenna to lose its reference basis as a standard device.
The energy distribution laws within the waveguide determine the polarization purity of the antenna. In the TE10 mode, the electric field vector is strictly perpendicular to the wide wall of the waveguide. If TM11 or TE11 modes are introduced due to processing deformation or excessive frequency, significant cross-polarization components will be generated.
In actual RF link construction, understanding signal mode distribution at different frequencies helps predict measurement uncertainty. Below are specific impact indicators of mode distribution on antenna performance:
- Operating Band Limitation: Waveguide antenna operating bandwidth is usually limited to a ratio between 1.5:1 and 1.9:1 to avoid the heavy dispersion zone at the low end and the starting point of higher-order modes at the high end.
- Pattern Symmetry: In single-mode states, the E-plane and H-plane radiation patterns of the horn antenna show good symmetry. If higher-order modes appear, the H-plane pattern will show significant asymmetric distortion, and sidelobe levels may rise from a normal -20 dB to around -10 dB.
- Abnormal VSWR Jumps: When the frequency is at the critical point of mode transition, sharp resonance peaks appear in the antenna’s VSWR due to impedance differences between modes. In Ka-band testing from 26.5 GHz to 40 GHz, this phenomenon often prevents system calibration at specific frequency points.
- Group Delay Flatness: Single-mode transmission ensures consistent delay performance as the signal passes through the horn antenna. In ultra-wideband pulse testing or 5G millimeter-wave experiments, multi-mode coexistence leads to severe phase distortion, causing signal pulses to broaden or deform.
- Cross-Polarization Discrimination (XPD): High-quality standard gain horns in the single-mode range typically have cross-polarization levels below -35 dB. As the frequency approaches the higher-order mode region, cross-polarization components rise rapidly due to cluttered electric field distribution, interfering with the accurate judgment of the target antenna’s polarization characteristics.
In the TE10 mode, the wave impedance is infinite at the cutoff frequency, decreases as frequency rises, and eventually approaches the 377 ohms of free space.
When performing link budgeting, the impact of frequency on this impedance matching must be considered.
In WR-28 waveguide, if the test frequency changes from 26.5 GHz to 40 GHz, the wave impedance range will drop from about 500 ohms to approximately 410 ohms.
This change quantifies the design difficulty of the impedance transformer between the antenna’s rear feed and the horn cone.
To compensate for such impedance fluctuations in the frequency domain, the internal transition sections of standard gain horns are usually machined into exponential or linearly varying steps to ensure efficient energy transmission across the entire band.
The stability of the phase center is closely related to mode distribution. In single-mode states, the antenna’s phase center moves slowly toward the horn throat as frequency increases, with the displacement typically on the order of the wavelength.
The electric field distribution in the TE10 mode is most conducive to heat dissipation and voltage distribution, effectively delaying the occurrence of air breakdown.
Once higher-order modes appear, electric field intensity creates local gathering points inside the waveguide, which significantly reduce the antenna’s power capacity.
In the millimeter-wave V-band (50 GHz to 75 GHz), as internal space is only 3.76 mm x 1.88 mm, any unstable mode distribution leads to overheat-induced deformation of the inner walls in a short time.
For antennas of the WR-15 standard, to maintain mode purity and power stability, it is recommended to use a pressurized nitrogen filling process during full-power operation to increase the breakdown limit of the internal dielectric and maintain electromagnetic consistency.
For laboratory environments, a practical method to detect mode purity is to observe the curve of gain vs. frequency.
In a clean single-mode operating range, the gain curve should show a smooth logarithmic upward trend, with the gain value proportional to the square of the frequency.
If significant dips or non-linear steps are observed in the curve, it usually indicates that parasitic modes have been triggered at those frequency points.
This mode interference often stems from misalignment at the waveguide flange connection.
For example, in W-band (75 GHz to 110 GHz) testing, if a radial misalignment of 0.05 mm exists between two UG-387 flanges, asymmetric mode components will be excited at the connection, causing gain measurements to deviate from theoretical estimates by as much as 0.8 dB.
Standard gain horns of different bands have different emphases when handling mode distribution.
- Low Frequency (L/S/C Bands): Due to large waveguide dimensions, manufacturing tolerances are minimal relative to wavelength, mode purity is extremely high, and gain uncertainty can typically be controlled within 0.2 dB.
- Mid Frequency (X/Ku/K Bands): This is the most widely used area; the selection rule of 1.25 times the cutoff frequency must be strictly followed to avoid waveguide dispersion interference with group delay measurements.
- High Frequency (V/E/W Bands): The focus is on the physical precision of flange connections, as tiny mechanical steps instantly become mode converters; precision pins must be used for positioning during installation.
- Terahertz Bands (Above 110 GHz): Waveguide dimensions enter the sub-millimeter scale, where traditional TE10 mode transmission losses rise significantly; attention must be paid to intensified mode attenuation caused by surface roughness.
In D-band (110 GHz to 170 GHz) experiments involved in 6G research, researchers must use high-precision Vector Network Analyzers (VNA) to scan the VSWR response across the entire band to ensure no phase jumps caused by mode transitions occur during the test sequence.
Gain & Directivity
Standard gain horn antennas across WR-284 to WR-10 waveguide specifications often have gain settings of 10, 15, 20, or 25 dBi.
Directivity is entirely determined by the physical dimensions of the aperture, while gain accounts for conduction losses of approximately 0.1 to 0.5 dB.
Across the entire band, gain increases linearly with rising frequency, with a slope of approximately 6 dB per octave.
The half-power beamwidths (HPBW) in the E-plane and H-plane typically range between 10 and 40 degrees, with aperture efficiency maintained between 50% and 80%, providing a stable reference benchmark for RF measurements.
Physical Aperture & Performance
If the aperture area is doubled, the theoretical directivity increases by 3 dB, but this requires the horn’s length to also be doubled to compensate for phase difference.
In millimeter-wave bands, such as the WR-10 band (75 to 110 GHz), aperture dimensions usually shrink to the 10 mm scale, where the impact of processing precision on performance rises significantly.
Wall thickness is typically kept between 1.0 mm and 2.5 mm to ensure the aperture does not deform during high-low temperature cycle testing.
| Waveguide Spec | Nominal Gain (dBi) | Typ. Aperture Width (mm) | Typ. Aperture Height (mm) | Total Horn Length (mm) |
|---|---|---|---|---|
| WR-112 (X-Band) | 15 | 78.5 | 58.2 | 125.0 |
| WR-112 (X-Band) | 20 | 142.1 | 105.4 | 280.0 |
| WR-42 (K-Band) | 20 | 52.4 | 38.8 | 115.0 |
| WR-15 (V-Band) | 24 | 28.5 | 22.1 | 85.0 |
The internal surface roughness of standard gain horns must be controlled below 1.6 microns. If the inner walls are too rough, it leads to an additional loss of about 0.2 dB per meter in high frequency bands (above 40 GHz).
When electromagnetic waves enter the horn transition zone from the waveguide, the wavefront changes from a plane wave to a spherical wave. This transition creates quadratic phase errors that lead to decreased aperture efficiency.
To minimize this error, standard gain horns typically adopt a long horn, small flare angle design solution.
Although this increases the physical volume of the antenna, it ensures that the gain flatness within the main lobe is better than 0.5 dB across the entire band.
In designing high-gain horns of 25 dBi or more, the length often exceeds 500 mm to ensure the electromagnetic field distribution on the aperture surface is as close to ideal as possible.
Material selection directly affects the antenna’s conductivity. Most standard horns are manufactured from 6061-T6 aluminum alloy or OFHC oxygen-free copper.
Aluminum horns are lightweight, but their conductivity is approximately 3.5 x 10^7 Siemens per meter;
In comparison, silver-plated copper horns can increase conductivity to 6.3 x 10^7 S/m.
The table below compares the impact of common materials on antenna performance:
| Material Type | Conductivity (S/m) | Typical Insertion Loss (dB) | Advantageous Application |
|---|---|---|---|
| 6061 Aluminum | 3.5E+07 | 0.3 – 0.5 | General lab testing, EMC environments |
| C10100 Pure Copper | 5.8E+07 | 0.1 – 0.2 | High-precision gain benchmark, satellite links |
| Internal Silver-plating (5um) | 6.3E+07 | < 0.1 | Millimeter-wave, sub-millimeter wave calibration |
Edge diffraction effects at the physical aperture are the main cause of gain fluctuations. As waves propagate to the horn edge, they produce backward radiation, creating a ripple of about 0.1 to 0.2 dB on the gain vs. frequency curve. High-quality horns weaken this interference through precise calculation of edge thickness and shape.
In mechanical processing, the flatness error of the horn aperture must be limited to within one-thirtieth of a wavelength.
For testing at 60 GHz, the flatness tolerance of the aperture surface should be better than 0.16 mm.
If the aperture surface warps, it causes asymmetry in the E-plane and H-plane beams, leading to decreased polarization purity, where cross-polarization levels might worsen from a normal -40 dB to -25 dB.
Furthermore, alignment precision of waveguide flanges (such as UG-387 or CPR series) also has a minor impact on gain, where a flange offset of 0.1 mm can introduce a 0.05 dB measurement deviation.
The slope relationship between gain and frequency is a fixed physical characteristic determined by the aperture area.
In a standard octave waveguide, the gain difference between the low-end and high-end frequencies is usually around 6 dB.
When performing broadband sweep measurements, users must rely on the Gain Calibration Table provided by the manufacturer for interpolation, typically with steps of 50 MHz or 100 MHz.
This data density ensures linearity across the entire operating bandwidth, avoiding calculation errors caused by frequency jumps.
The phase center of a standard gain horn is not fixed on the aperture plane. As frequency increases, the phase center moves slightly toward the interior of the horn. In near-field scanning or compact antenna test range (CATR) testing, this displacement of a few millimeters must be considered, otherwise it causes discontinuity in phase measurement.
The rigid structural design of the horn is intended to prevent thermal expansion due to temperature rise under high power input.
When 100 watts of continuous wave power is injected, the temperature rise in an aluminum horn can lead to micron-level expansion in aperture size.
While this change’s impact on gain in the X-band is negligible, in the W-band, gain drift caused by thermal expansion can reach 0.05 dB.
Therefore, in high-power scenarios, heat sinks are typically added, or Invar alloy materials with lower thermal expansion coefficients are used.
Frequency Impact on Gain
In RF engineering practice, the rate of gain change with frequency follows the theoretical slope of increasing by 6 dB per octave.
Although actual manufactured horns may deviate slightly from this value due to internal phase differences and changes in aperture efficiency, this linear growth pattern is very stable.
For a WR-62 specification horn (12.4 to 18.0 GHz), its frequency coverage ratio is approximately 1.45:1, leading to a gain fluctuation of about 3 dB across the operating band.
Users performing broadband sweep tests must interpolate using the calibration tables provided by the manufacturer, typically extracting a gain point every 100 MHz or 200 MHz to ensure accurate link budgets and prevent measurement deviations exceeding 0.5 dB by ignoring the frequency slope.
- WR-28 Band Data (26.5-40 GHz):
- Frequency 26.5 GHz: Nominal gain 23.1 dBi, E-plane beamwidth approx. 11.5 degrees.
- Frequency 33.0 GHz: Nominal gain 24.8 dBi, E-plane beamwidth narrows to 9.8 degrees.
- Frequency 40.0 GHz: Nominal gain 26.3 dBi, E-plane beamwidth only 8.2 degrees.
- WR-42 Band Data (18.0-26.5 GHz):
- Low end 18.0 GHz: Typical gain 19.8 dBi, aperture efficiency approx. 62%.
- High end 26.5 GHz: Typical gain 22.9 dBi, aperture efficiency slightly drops to 58% due to phase error.
- WR-112 Band Data (7.05-10.0 GHz):
- Low end 7.05 GHz: Gain 14.2 dBi.
- Center 8.50 GHz: Gain 15.7 dBi.
- High end 10.0 GHz: Gain 17.1 dBi.
Minor ripples in gain vs. frequency usually stem from diffraction wave reflections at the horn aperture edges. This reflected wave returns to the waveguide feed, interfering with the primary wave. In high-quality standard gain horns, this edge-effect-induced gain fluctuation is controlled within ±0.15 dB. Using low-cost non-standard horns can amplify this fluctuation to over 0.5 dB, severely interfering with precision calibration.
In low-frequency bands, the path difference from the waveguide throat to the aperture surface is relatively small compared to the wavelength, resulting in a uniform phase distribution; here, aperture efficiency can reach 75% to 80%.
As frequency rises, the same physical path difference corresponds to an increased electrical angle, causing the phase at the aperture edges to lag behind the center.
This phase distortion suppresses further gain growth, causing aperture efficiency in high-frequency bands to drop to around 55% to 60%.
Well-designed standard horns mitigate this phase difference by increasing the physical length, thereby achieving gain values closer to the theoretical limit at high-end frequencies.
For millimeter-wave applications, such as WR-10 (75 to 110 GHz), the impact of frequency on gain is reflected not only in geometric scale but also in conduction losses on metallic surfaces.
At a 100 GHz frequency, the skin depth is only about 0.2 microns.
As frequency rises, conductor loss increases with the square root of the frequency, offsetting some of the gain increase brought by the expanded aperture.
The table below shows the correction reference for actual gain after material loss and frequency superposition:
| Frequency Range (GHz) | Theoretical Gain Growth (dB) | Material Loss Correction (dB) | Net Gain Change (dB) |
|---|---|---|---|
| 10 – 15 | +3.5 | -0.02 | +3.48 |
| 40 – 60 | +3.5 | -0.08 | +3.42 |
| 90 – 110 | +1.7 | -0.15 | +1.55 |
| 140 – 220 | +3.9 | -0.35 | +3.55 |
Gain calibration of standard gain horns typically refers to the NIST (National Institute of Standards and Technology) three-antenna measurement method. Its uncertainty increases with frequency: usually ±0.2 dB below 10 GHz, expanding to ±0.5 dB or more above 100 GHz.
Frequency changes also lead to drifting of the antenna’s phase center.
In broadband measurement, if the phase center is assumed to be fixed on the aperture plane, phase data measured will produce a non-linear offset as frequency rises, because the actual position moves toward the horn throat.
In X-band standard horns, this displacement can reach 10 mm to 20 mm.
When performing gain reference measurements, failing to correct this frequency-dependent distance difference causes a calculation error of about 0.1 dB.
Furthermore, the relationship between gain and frequency is affected by the VSWR at the waveguide flange connection.
While standard gain horns possess excellent bandwidth characteristics, if the flange connection produces a weak reflection at certain frequency points (e.g., VSWR reaches 1.2), the net power injected into the antenna decreases, causing a minor dip in the manifested “effective gain.”
High-quality antennas ensure VSWR < 1.1 across the band through precision machining, ensuring gain curve smoothness and avoiding sudden performance pits at specific points.
As rising frequency causes beamwidth to narrow, pointing accuracy requirements for high-frequency antennas also increase significantly.
At 12 GHz, the 0.1 dB gain-drop angle for a 20 dBi horn is approximately 2.5 degrees;
When the frequency rises to 18 GHz, the same pointing deviation could lead to 0.4 dB of signal attenuation.
Beamwidth Distribution
Due to the field distribution characteristics of the TE10 mode in the waveguide, standard gain horns do not have perfectly symmetric beamwidths in the E-plane (electric field plane) and H-plane (magnetic field plane).
In most designs, the amplitude distribution in the E-plane is close to a uniform distribution, while the H-plane distribution follows a cosine distribution.
This results in the E-plane beam usually being narrower than the H-plane beam, with the ratio often maintained around 1.1:1.
For instance, in 10 GHz X-band testing, the E-plane HPBW for a standard 20 dBi horn might be 16.5 degrees, while the H-plane HPBW is 18.2 degrees.
This asymmetry must be quantitatively corrected when calculating the antenna’s effective coverage area to prevent a reception level difference exceeding 0.2 dB during vertical and horizontal polarization switching.
- 10 dBi Gain Level:
- Typical HPBW Range: 52 to 58 degrees.
- Scenario: Short-range wide-angle coverage for monitoring general EM environments in labs.
- 10 dB Beamwidth: Approx. 1.8x HPBW, coverage area up to 100 degrees.
- 20 dBi Gain Level:
- Typical HPBW Range: 15 to 18 degrees.
- Scenario: Standard far-field test benchmark, providing uniform illumination at 3m to 5m.
- Sidelobe Suppression: First sidelobe level typically below -13 dB (E-plane) and -20 dB (H-plane).
- 25 dBi Gain Level:
- Typical HPBW Range: 7.5 to 9 degrees.
- Scenario: Long-range radar cross-section (RCS) measurement or high-sensitivity reception.
- Alignment Sensitivity: A 2-degree deviation from the central axis causes approx. 0.5 dB signal attenuation.
Within a standard 1.5:1 waveguide bandwidth, the beam smoothly tightens as frequency moves from low to high.
Taking a 20 dBi horn of WR-62 (12.4 to 18 GHz) specification, at 12.4 GHz, the H-plane beamwidth is about 19.5 degrees;
As frequency increases to 18 GHz, this angle narrows to approximately 13.8 degrees due to increased electrical aperture size.
Users configuring automated test scripts for multi-frequency scans must invoke the beamwidth parameter tables for each frequency point to ensure the device under test (DUT) remains in the main lobe’s effective illumination zone.
It is generally recommended that the physical span of the DUT does not exceed one-third of the antenna’s HPBW coverage to maintain field strength uniformity within a 0.5 dB deviation.
In actual measurement, besides the 3 dB beamwidth, the 10 dB beamwidth is also critical for evaluating feed performance for reflector antennas. For standard horns used as parabolic feeds, the -10 dB illumination angle determines spillover loss at the reflector edges. High-performance horns have -10 dB widths between 30 and 60 degrees; controlling this indicator precisely can raise overall antenna efficiency by more than 15%.
In 5G millimeter-wave bands like 26 GHz to 40 GHz, if there is a wall thickness inconsistency or a displacement over 0.05 mm in the feed during processing, beam squint occurs.
This offset causes the maximum gain direction to no longer point to the physical centerline, leading to phase discontinuities during multi-band measurements.
High-quality equipment limits beam pointing accuracy to within 0.5 degrees, ensuring that the geometric overlap of E-plane and H-plane phase centers is better than 2 mm across the entire band.
Sidelobe Level (SLL) distribution is also constrained by beamwidth. As the main lobe narrows and energy concentration increases, the relative level of sidelobes typically decreases.
In WR-28 waveguide (26.5 to 40 GHz), the first sidelobe for a 20 dBi horn usually appears 35 to 45 degrees off the main axis. In an anechoic chamber, energy radiated from these sidelobes may reflect off walls and restack onto the main receive channel, creating a ripple error of about 0.15 dB.
Therefore, when selecting narrow-beam (high-gain) horns, one must simultaneously evaluate the absorber efficiency in the test area to ensure that at the sidelobe pointing angles, absorption performance is better than -40 dB.
Phase center stability within the beamwidth affects distance compensation accuracy. In wide-beam (low-gain) horns, the phase center position shifts significantly with frequency, potentially by 3 mm per GHz.
In narrow-beam (high-gain) horns, because the propagation inside the horn is closer to a plane wave, the phase center shift is relatively reduced, typically maintained within 1 mm per GHz.
VSWR & Return Loss
In the technical specifications of standard gain horn antennas, the VSWR is typically required to be below 1.15 to 1.30 across the entire waveguide band.
Taking a WR-28 waveguide horn as an example, in the 26.5 to 40 GHz range, a VSWR of 1.15 corresponds to a return loss of 23.1 dB, where power reflection is only 0.5%.
According to IEEE 149 measurement standards, this low-reflection characteristic can reduce gain measurement uncertainty to below 0.05 dB, ensuring RF energy moves smoothly from the transmission line into the radiated airspace.
Matching Parameter Basics
In millimeter-wave bands like WR-10 (75 GHz – 110 GHz), impedance matching requires higher precision.
Tiny mechanical processing errors, such as a 0.01 mm size deviation at the horn throat, can induce VSWR spikes at specific frequency points.
According to IEEE 149 standards, high-precision gain calibration experiments typically require that VSWR fluctuations across the band remain below 0.05.
For a 20 dBi horn, if the VSWR at the interface worsens from 1.15 to 1.40, the resulting mismatch loss fluctuation causes the measured gain to deviate from theoretical values by more than 0.12 dB.
- VSWR 1.05 corresponds to 32.2 dB return loss, reflection coefficient 0.024, power transmission efficiency 99.94%.
- VSWR 1.20 corresponds to 20.8 dB return loss, reflection coefficient 0.091, power transmission efficiency 99.17%.
- VSWR 1.35 corresponds to 16.5 dB return loss, reflection coefficient 0.149, power transmission efficiency 97.78%.
- VSWR 1.50 corresponds to 13.9 dB return loss, reflection coefficient 0.200, power transmission efficiency 96.00%.
In K-band applications above 18 GHz, the internal conductor alignment precision of 2.92 mm connectors significantly affects VSWR.
If the dielectric constant of the internal support material in an adapter changes by 1%, the VSWR curve will show periodic oscillations across the band.
When selecting, one must review the overall VSWR curve including adapters, rather than just the simulation data of the antenna body.
High-performance waveguide horns are typically tested strictly with a VNA before leaving the factory to ensure reflection parameters remain smooth between 1.1 and 1.9 times the cutoff frequency.
Under laboratory conditions where ambient temperature fluctuates, thermal expansion/contraction of metal causes minor impedance changes.
An OFHC copper horn rising 30°C will see the WR-28 wide-wall dimension increase slightly due to its expansion coefficient of 17 ppm/°C.
While this change’s contribution to VSWR is usually on the order of 0.01, in ultra-low VSWR applications (e.g., VSWR < 1.05), this drift causes return loss to drop from 35 dB to around 30 dB.
Therefore, keeping interface temperature constant during long-term stability testing helps maintain impedance matching consistency.
- Frequency Response Distribution: VSWR is not constant across the band; it’s typically highest near the waveguide cutoff frequency and relatively stable in the middle-to-end of the band.
- Uncertainty Budget: When the source VSWR is 1.25 and the load (antenna) VSWR is 1.20, the module error for mismatch uncertainty is approx. 0.17 dB.
- Physical Damage Detection: A sudden step jump exceeding 0.3 in the VSWR test curve usually indicates contaminants inside the antenna or displacement at the flange connection.
- Phase Stability: Good impedance matching correlates with stable phase linearity; antennas with return loss > 20 dB show smaller group delay jitter in broadband pulse measurements.
In E-band (60-90 GHz) testing, flange interface flatness must be better than 5 microns.
If a tiny gap exists between two flanges, it’s equivalent to a parallel inductor in the transmission path, which causes VSWR to rise rapidly.
By using high-precision alignment pins and standard-compliant torque wrenches, interface return loss for bands above 75 GHz can be stabilized above 25 dB.
For WR-15 and smaller millimeter-wave horns, impedance matching is also affected by internal plating roughness.
Inconsistent gold or silver plating introduces equivalent resistance changes within the skin depth where high-frequency current gathers.
This micro-level impedance discontinuity manifests as a rise in the return loss baseline for tests above 110 GHz.
At this stage, even if mechanical dimensions comply perfectly with drawings, local conductivity differences can make real-world VSWR about 0.1 higher than theoretical predictions.
Thus, selection of high-frequency horns should focus on inner cavity surface roughness (typically required to be < 0.4 microns) to ensure highly reliable impedance matching over long-term use.
Quantitative Data Conversion
When VSWR changes from 1.10 to 1.15, although the value fluctuates by only 0.05, return loss drops from 26.44 dB to 23.13 dB, and power reflection doubles from 0.23% to 0.48%.
This non-linear conversion requires recording measurement results with at least two decimal places to capture subtle performance degradation in millimeter-wave bands.
The table below lists detailed conversion data from near-perfect matching to engineering tolerance limits, covering common ranges from precision lab antennas to industrial-grade antennas:
| VSWR | Return Loss (dB) | Reflect. Coeff (Rho) | Reflect. Power (%) | Trans. Power (%) | Mismatch Loss (dB) |
|---|---|---|---|---|---|
| 1.01 | 46.06 | 0.005 | 0.002% | 99.998% | 0.0001 |
| 1.02 | 40.09 | 0.010 | 0.01% | 99.99% | 0.0004 |
| 1.05 | 32.26 | 0.024 | 0.06% | 99.94% | 0.0026 |
| 1.10 | 26.44 | 0.048 | 0.23% | 99.77% | 0.0102 |
| 1.15 | 23.13 | 0.070 | 0.48% | 99.52% | 0.0211 |
| 1.20 | 20.83 | 0.091 | 0.83% | 99.17% | 0.0362 |
| 1.25 | 19.08 | 0.111 | 1.23% | 98.77% | 0.0541 |
| 1.30 | 17.69 | 0.130 | 1.70% | 98.30% | 0.0746 |
| 1.40 | 15.56 | 0.167 | 2.78% | 97.22% | 0.1223 |
| 1.50 | 13.98 | 0.200 | 4.00% | 96.00% | 0.1773 |
| 2.00 | 9.54 | 0.333 | 11.11% | 88.89% | 0.5115 |
In precision gain measurement, mismatch uncertainty caused by VSWR is more destructive than simple power reflection.
When a standard gain horn is connected as a load to a signal source or amplifier, multiple reflections between the two ports produce phase superposition.
Assume the source port VSWR is 1.20 (Rho 0.091) and the antenna port VSWR is 1.10 (Rho 0.048); multiplying the reflection coefficients gives 0.00437.
Converting this to logarithmic scale represents a measurement ripple of ±0.038 dB.
If antenna VSWR worsens to 1.50, this impedance-mismatch uncertainty expands rapidly to ±0.16 dB.
In calibration labs pursuing 0.1 dB precision, such deviations render the final gain data invalid.
The impact of mismatch uncertainty on measurement results is shown below, assuming a fixed source VSWR and observing gain measurement deviation ranges (in dB) across different antenna VSWR levels:
| Source VSWR | Antenna VSWR (1.10) | Antenna VSWR (1.20) | Antenna VSWR (1.30) | Antenna VSWR (1.50) |
|---|---|---|---|---|
| 1.10 | +/- 0.02 | +/- 0.04 | +/- 0.06 | +/- 0.10 |
| 1.20 | +/- 0.04 | +/- 0.08 | +/- 0.11 | +/- 0.16 |
| 1.30 | +/- 0.06 | +/- 0.11 | +/- 0.16 | +/- 0.24 |
| 1.50 | +/- 0.10 | +/- 0.19 | +/- 0.26 | +/- 0.40 |
| 2.00 | +/- 0.19 | +/- 0.36 | +/- 0.50 | +/- 0.77 |
The dimensional accuracy of waveguide standards is tightly linked to the converted VSWR performance.
In WR-28 (26.5 GHz – 40 GHz) specs, the wide-wall is 7.112 mm and the narrow-wall is 3.556 mm.
If machining tolerances cause the wide-wall to deviate by 0.02 mm, the characteristic impedance at 35 GHz will shift by about 1.5 ohms.
Based on impedance reflection logic, this physical size deviation raises VSWR from a theoretical 1.05 to around 1.08.
For higher bands like WR-10 or WR-12, skin depth is usually < 1 micron; waveguide surface roughness at this stage introduces extra equivalent reactance, making measured return loss fluctuate by 2 dB to 3 dB across the band.
- WR-42 (K-Band): Typical VSWR for high-quality horns is 1.12, representing transmission efficiency > 99.7% in the 18-26.5 GHz band.
- WR-28 (Ka-Band): Influenced by interface adapters, overall VSWR often floats around 1.15 in the 26.5-40 GHz band, with mismatch loss of approx. 0.02 dB.
- WR-15 (V-Band): Due to flange alignment errors, a VSWR of 1.25 is common engineering practice in the 50-75 GHz band, where reflected power exceeds 1.2%.
A 2-meter phase-stable cable introduces approx. 4 dB two-way insertion loss at 40 GHz, which to some extent “masks” the true reflection parameters at the antenna end, making VNA-measured return loss look better than the actual aperture situation.
For example, if antenna return loss is truly 15 dB, passing through a 4 dB loss cable results in the VNA receiving a signal that has undergone 8 dB round-trip attenuation, showing a fake 23 dB result (VSWR 1.15).
To correct this misleading data, full two-port calibration or port extension must be performed at the antenna input.
Polarization of water molecules slightly changes the relative permittivity of the waveguide dielectric; when relative humidity rises from 30% to 90%, the propagation constant shifts. While the direct contribution to VSWR is usually minimal, in ultra-low reflection systems (return loss > 35 dB), this environmental change raises the baseline of the test curve.
For standard gain horns used long-term outdoors, it’s recommended to install low-loss polyimide film windows to prevent condensation from entering the waveguide cavity and breaking impedance matching continuity.
Impact on Link Accuracy
When performing gain transfer method tests in Ka-band (26.5 to 40 GHz), mismatch between the source port and antenna input port is the primary source of uncertainty.
If the signal source output VSWR is 1.4 and the standard gain horn VSWR is 1.2, multiple reflections will form between the two ports.
This phenomenon manifests as signal bouncing in the time domain and ripples on the gain curve in the frequency domain.
The ripple amplitude is typically around ±0.15 dB; for precision experiments requiring total system error under 0.5 dB, this single factor occupies one-third of the error budget.
Source VSWR 1.4 with antenna VSWR 1.2 creates a module error of approx. 0.16 dB.
Reflected signals moving in the transmission line induce periodic jitter in the gain curve.
Total system error budgets are usually limited to 0.5 dB.
Standard gain horn antennas are often used with waveguide-to-coaxial adapters.
If the dielectric support structure inside the adapter is poorly designed, it will introduce parasitic capacitance at specific frequency points.
For a 20 dBi horn antenna, if return loss worsens from 25 dB to 15 dB, effective power entering the radiation cavity decreases by about 3%.
While 3% power loss seems like only 0.13 dB, the real trouble is phase non-linearity caused by mismatch.
In broadband sweep tests, this non-linearity causes jumps in group delay, affecting pulse signal waveform fidelity.
In high-resolution radar target simulation or satellite link experiments, phase errors from substandard VSWR lead to decreased range resolution or false target responses.
3% power loss corresponds to approx. 0.13 dB gain deviation.
Dropping return loss from 25 dB to 15 dB significantly breaks phase linearity.
Phase jumps directly affect range-direction metrics for high-resolution radar.
In the V-band above 50 GHz, every meter of flexible cable introduces approx. 3 dB to 5 dB of loss.
If antenna VSWR is poor, the reflected signal traveling back through the long cable will be “diluted” by the cable’s insertion loss, making the VSWR curve on the VNA look excellent—but this is an illusion.
This fake measurement data makes engineers believe the link is well-matched, while in actual far-field gain calculations, the real reflection at the aperture has not disappeared; it still causes energy loss at the horn throat.
Cable insertion loss at 50 GHz can reach 5 dB per meter.
Cable loss masks the antenna’s true return loss data.
This illusion causes measured gain to remain lower than theoretical expectations long-term.
Taking WR-15 waveguide as an example, if the flange bolt tightening torque doesn’t reach the standard 8 inch-pounds, the resulting tiny gap acts as a parallel inductive load.
This load causes the originally flat VSWR curve to show a peak above 2.0 near 60 GHz.
Such local frequency failure causes narrowband signal transmission accuracy to collapse instantly.
In precision links, a torque wrench should be used to ensure consistency in every connection.
If there is a 0.05 mm alignment deviation, the reflection coefficient Rho rises from 0.05 to about 0.15, and return loss drops from 26 dB to 16 dB, making gain calibration repeatability very poor.
Waveguide flange tightening torque standard is typically 8 inch-pounds.
0.05 mm misalignment causes return loss to drop by 10 dB.
Inconsistent mechanical connection leads to experimental repeatability below 90%.
While aluminum standard gain horns are lightweight, the coefficient of linear expansion for aluminum is much higher than for oxygen-free copper.
With a 20°C temperature change, a change in WR-42 waveguide length causes a minor shift in the phase constant.
For single-point frequency gain tests, the impact might only be 0.02 dB, but in multi-path simulation or phased array calibration, this phase drift is amplified through the link, causing beam pointing offsets.
To maintain long-term link accuracy, precision antenna tests in standard labs are conducted in anechoic chambers with temperature controlled to ±1°C, specifically to avoid impedance-matching drift caused by physical size changes.
Thermal expansion in aluminum is more significant than in oxygen-free copper.
A 20°C temperature difference causes phase constant changes inside the waveguide.
Constant temperature environments are the foundation for maintaining 0.02 dB level precision.
Although VSWR reflects co-polarization matching, if poor return loss is caused by manufacturing issues (like asymmetric feeds), it’s usually accompanied by increased cross-polarization levels.
In satellite links, if primary polarization reflection is severe, energy converts to orthogonal components, decreasing channel isolation.
High-performance horns require cross-polarization better than 30 dB to 40 dB.
If physical deformation degrades return loss, this indicator might worsen to 20 dB.
In link calculations, the 100-fold increase in interference signal strength severely disrupts receiver sensitivity testing.