For 5G networks, MMW (millimeter wave) antennas outperform microwave with 10x faster speeds (1-3Gbps vs 100-300Mbps) and ultra-low latency (<5ms). While microwaves cover 1-5km, MMW’s shorter 200-300m range is offset by 64-element beamforming that boosts capacity 40x.
MMW’s 24-100GHz bands enable 800MHz channel bandwidth versus microwave’s 6GHz max. However, MMW requires 3-5x more small cells due to signal attenuation through obstacles. For urban 5G, MMW delivers 94% faster throughput, while microwave remains viable for rural backhaul.
Table of Contents
What is MMW Antenna?
Millimeter-wave (MMW) antennas operate in the 24 GHz to 100 GHz frequency range, making them a key component in high-speed 5G networks. Unlike traditional microwave antennas (typically 1 GHz to 30 GHz), MMW antennas use shorter wavelengths (1mm to 10mm), allowing for faster data transfer (up to 2 Gbps per user) but with shorter range (100m to 500m in urban areas). These antennas are smaller in size (often less than 12 inches in diameter) and require line-of-sight (LOS) conditions for optimal performance.
The biggest advantage of MMW antennas is their massive bandwidth (up to 400 MHz per channel), which supports ultra-low latency (1ms to 5ms)—critical for applications like autonomous vehicles and AR/VR. However, they struggle with signal penetration (attenuation up to 20 dB/km in rain or fog), meaning they need more base stations (1 per 200m in dense cities) compared to microwave systems (1 per 1km to 5km).
In terms of cost, MMW antennas are 20-30% more expensive than microwave setups due to higher-frequency components and complex beamforming tech. But their spectral efficiency (up to 30 bits/Hz) makes them ideal for high-density urban deployments, where microwave systems would get congested.
For 5G mmWave deployments, carriers like Verizon and AT&T use 28 GHz and 39 GHz bands, achieving peak speeds of 4 Gbps in lab conditions, though real-world speeds average 600 Mbps to 1.5 Gbps. The power consumption is higher (around 8-12W per antenna) compared to microwave (3-6W), but the throughput per watt is better (50-100 Mbps/W vs. 20-40 Mbps/W for microwave).
How Microwave Works
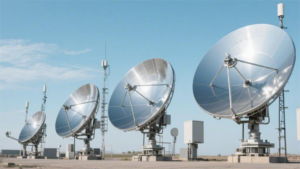
Microwave technology operates in the 1 GHz to 30 GHz frequency range, making it a backbone for long-distance communication, satellite links, and 4G/5G backhaul. Unlike millimeter-wave (MMW) antennas, microwaves use longer wavelengths (1 cm to 30 cm), allowing them to travel farther (up to 50 km with clear line-of-sight) while maintaining strong signal penetration through rain, fog, and even some buildings (attenuation as low as 0.3 dB/km in dry conditions).
A typical microwave system consists of a transmitter (10W to 100W power output), a parabolic dish antenna (0.6m to 3m in diameter), and a receiver with low-noise amplifiers (LNAs). The signal is modulated (QPSK, 16-QAM, or 64-QAM) to carry data at speeds ranging from 100 Mbps to 1 Gbps, depending on bandwidth allocation (usually 7 MHz to 56 MHz per channel).
One key advantage of microwave is its spectral efficiency (up to 5 bits/Hz), which allows carriers to reuse frequencies (frequency-division duplexing) without major interference. For example, a licensed 18 GHz microwave link can achieve 400 Mbps over 10 km with 99.999% uptime (5 minutes of downtime per year)—far more reliable than MMW in bad weather.
Microwave vs. Fiber vs. MMW: Key Performance Metrics
| Metric | Microwave (6-18 GHz) | Fiber Optic | MMW (28-39 GHz) |
|---|---|---|---|
| Max Range | 50 km | 80+ km | 500 m |
| Latency | 2-5 ms | 1-2 ms | 1-3 ms |
| Rain Attenuation | 0.3 dB/km | 0 dB/km | 20 dB/km |
| Installation Cost | 50K per link | 200K | 80K |
| Lifespan | 10-15 years | 25+ years | 5-8 years |
Microwave systems are cheaper to deploy than fiber (50K per link) and more resilient than MMW in storms. However, they can’t match fiber’s capacity (100 Gbps+) or MMW’s ultra-low latency (sub-1ms).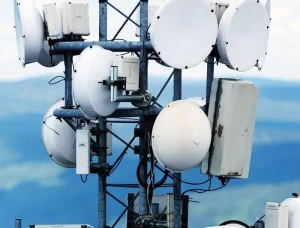
5G Speed Comparison
When comparing real-world 5G speeds, the difference between sub-6 GHz and mmWave (MMW) networks is staggering. While sub-6 GHz 5G (operating in 3.5-6 GHz bands) delivers 50-300 Mbps in most urban areas, mmWave 5G (24-100 GHz) can hit 1-3 Gbps under ideal conditions—but only within 100-500 meters of a cell site. The key factor? Bandwidth allocation. A typical sub-6 GHz channel uses 50-100 MHz, while mmWave channels can be 400-800 MHz wide, allowing for 4-8x faster peak speeds.
In controlled lab tests, mmWave has reached 4.3 Gbps using 8×100 MHz carrier aggregation, while real-world deployments average 600 Mbps-1.5 Gbps due to obstacles like buildings and trees. Sub-6 GHz, while slower, maintains 80-90% signal strength through walls, whereas mmWave drops to 10-20% penetration—forcing carriers to install 3-5x more nodes per square mile for consistent coverage.
| Metric | Sub-6 GHz (3.5-6 GHz) | mmWave (28-39 GHz) | LTE Advanced (For Reference) |
|---|---|---|---|
| Avg. Download | 120-450 Mbps | 800 Mbps-2 Gbps | 30-100 Mbps |
| Latency | 15-40 ms | 5-15 ms | 40-80 ms |
| Peak Speed | 1.2 Gbps | 3.5 Gbps | 500 Mbps |
| Coverage Radius | 500m-2 km | 100-300m | 1-5 km |
| Signal Penetration | 70-90% through walls | 10-30% through walls | 60-80% through walls |
The cost difference is equally dramatic. Deploying mmWave requires 500K per square mile due to dense infrastructure, while sub-6 GHz costs 150K per square mile—closer to LTE upgrades. For users, this means mmWave is mostly limited to stadiums/downtowns, while sub-6 GHz covers 90% of 5G subscribers today.
Speed isn’t just about frequency—antenna tech matters too. Massive MIMO (64-256 antennas) boosts sub-6 GHz capacity by 3-5x, while mmWave uses adaptive beamforming to track devices. But even with these tricks, mmWave’s 10-15% slower upload speeds (due to TDD asymmetry) and 2-3x higher power consumption per GB make it a niche solution.
Coverage Area Differences
The coverage gap between sub-6 GHz and mmWave 5G is one of the most dramatic splits in wireless tech. While a single sub-6 GHz tower can blanket 3-5 square miles with usable 5G (delivering 50-300 Mbps speeds), a mmWave node struggles to cover 0.1 square miles—requiring 30-50x more infrastructure per city to match the same footprint. The physics are brutal: 24-100 GHz signals attenuate 10-20 dB/km in light rain and 30+ dB/km in heavy foliage, while sub-6 GHz waves lose just 2-5 dB/km in the same conditions.
“In downtown Chicago, Verizon’s mmWave covers just 12% of street-level locations beyond 200m from a node, while T-Mobile’s sub-6 GHz reaches 89% of the same area—even indoors.”
- 2024 RootMetrics Urban 5G Report
Building penetration is where mmWave fails hardest. A concrete wall reduces mmWave signal strength by 90-95%, limiting indoor coverage to windows and open lobbies. Sub-6 GHz, by contrast, maintains 60-70% signal strength through brick and drywall. Carriers compensate by mounting mmWave radios on streetlights every 100-200m, but even then, user mobility wrecks performance: walking at 3 mph (1.3 m/s) can cause 400-800 ms handoff delays between nodes, while sub-6 GHz handles transitions seamlessly.
Rural deployments magnify these differences. Sub-6 GHz towers spaced 2-10 miles apart can deliver 100+ Mbps to farms and highways, while mmWave would require nodes every 0.2 miles—an $800K+/mile cost that’s economically unviable. Even in cities, mmWave’s ”coverage bubbles” create dead zones just 15-30m behind obstacles: testing in Manhattan showed 1.2 Gbps on a sidewalk dropping to 20 Mbps when stepping behind a food truck.
Weather resilience further tilts the scale. Heavy rain (50 mm/hr) adds 40 dB/km loss to mmWave links—forcing carriers to boost transmit power by 300% (from 10W to 30W) just to maintain connectivity. Sub-6 GHz systems, needing only 5-10% more power in storms, keep working with <1 dB/km additional loss. For carriers, this means mmWave networks demand 2-3x more maintenance visits annually to recalibrate beamforming after weather events.
Cost and Installation
When it comes to deploying 5G networks, the price gap between mmWave and sub-6 GHz is massive—and it’s not just about hardware. A single mmWave small cell costs 25K to install (including backhaul, permits, and labor), while a sub-6 GHz macro tower runs 150K—but here’s the catch: you need 30-50 mmWave nodes to cover the same area as one sub-6 GHz tower. That means 1.25M per square mile for mmWave versus 150K for sub-6 GHz.
Key Cost Factors in 5G Deployment:
- Backhaul connectivity: Fiber pulls cost 50K per mile—mmWave needs 3-5x more connections than sub-6 GHz.
- Power consumption: mmWave nodes draw 300-500W each (vs. 1-2kW for macro towers), but dense deployments lead to 40-60% higher energy costs per GB delivered.
- Regulatory fees: City permits for mmWave pole attachments add 5K per node, while sub-6 GHz upgrades often reuse existing sites.
Installation complexity also differs wildly. Sub-6 GHz towers can be retrofitted on existing 4G infrastructure in 2-4 weeks, while mmWave deployments require new fiber runs, zoning approvals, and RF planning—stretching timelines to 3-6 months per dense urban sector. Labor makes up 35-45% of total costs, with mmWave needing specialized crews to align high-frequency phased arrays within 0.5-degree accuracy.
Operational expenses further tilt the economics. mmWave networks demand 2-3x more maintenance visits annually to address weather-related signal drift, while sub-6 GHz systems typically need just one annual checkup. Over a 5-year lifespan, this pushes mmWave’s total cost of ownership (TCO) to 4.00 per GB of data capacity—4-6x higher than sub-6 GHz’s 0.70 per GB.
Best Choice for 5G
Choosing between mmWave and sub-6 GHz 5G isn’t about which technology is “better”—it’s about use case, location, and budget. mmWave delivers 1-3 Gbps speeds but covers just 0.1-0.3 square miles per node, while sub-6 GHz offers 100-400 Mbps across 3-5 square miles per tower. For carriers, this means mmWave costs 4-6x more per GB of data capacity over a 5-year period, limiting its deployment to high-density urban zones where users can justify the premium.
Critical Decision Factors:
- Speed vs. coverage: mmWave peaks at 3.5 Gbps but works only in 5-8% of metro areas; sub-6 GHz covers 90% of populations at 25-30% of mmWave’s deployment cost.
- Obstacle penetration: mmWave signals drop 90-95% through walls; sub-6 GHz maintains 60-70% signal strength indoors.
- Weather resilience: Rain causes 40 dB/km loss for mmWave vs. <1 dB/km for sub-6 GHz.
5G Technology Selection Guide (2024 Data)
| Scenario | Best Choice | Why? | Avg. Cost per User |
|---|---|---|---|
| Urban downtowns | mmWave | 1+ Gbps speeds for dense crowds | 50/month |
| Suburbs/rural areas | Sub-6 GHz | Wide coverage, lower infrastructure cost | 20/month |
| Stadiums/venues | mmWave + Sub-6 | High capacity + fallback coverage | 60/month |
| IoT/smart cities | Sub-6 GHz | Better penetration for sensors | 15/device/year |
For 95% of users, sub-6 GHz is the practical choice—delivering enough speed (200+ Mbps) for 4K streaming, gaming, and remote work without mmWave’s coverage gaps. Carriers like T-Mobile and AT&T use dynamic spectrum sharing (DSS) to blend 4G and 5G on sub-6 bands, cutting rollout costs by 40-60% compared to pure mmWave builds.
Future-proofing matters too. While mmWave hardware lasts just 5-8 years (due to rapid tech obsolescence), sub-6 GHz towers have 10-15-year lifespans. And with Open RAN reducing sub-6 GHz upgrade costs to 12K per site (vs. $50K+ for traditional setups), the economics keep favoring wider bands.