To optimize telecom antenna signal, elevate antennas 10-30m above ground (boosts range by 40%). Use 45° tilt for urban areas (reduces interference by 28%). Upgrade to 4×4 MIMO antennas (improves throughput by 3x). Avoid metal obstructions within 3m (signal loss up to 15dB). Regularly update firmware (patches improve performance by 22%).
Table of Contents
Check Antenna Position
A poorly positioned antenna can drop signal strength by 30-50%, leading to slow speeds, dropped calls, and unstable connections. Research from Ookla’s 2024 Global Speedtest Report shows that 68% of weak signal issues are caused by incorrect antenna placement—not hardware limitations. For example, moving an outdoor antenna just 1-2 meters higher can improve download speeds by 15-25 Mbps, while indoor antennas placed near windows see 40% lower interference from walls and appliances. Even small adjustments—like rotating an antenna 15-30 degrees—can boost signal-to-noise ratio (SNR) by 3-5 dB, a critical factor for 5G and LTE stability.
”In urban areas, antennas placed at 3-6 meters above ground level capture 20% stronger signals than those at 1-2 meters due to reduced obstructions.”
— Telecom Infrastructure Report, 2025
The vertical position of an antenna matters more than most users realize. A 2.4 GHz Wi-Fi signal loses ~7% strength per meter when blocked by drywall, and ~15% per meter through concrete. If your router’s antenna is tucked behind a TV or bookshelf, relocating it 0.5-1 meter away from obstacles can recover 10-20 dBm signal loss. For outdoor setups, 5G antennas mounted below 10 meters often suffer from multipath interference, where signals bounce off buildings, reducing effective bandwidth by up to 35%.
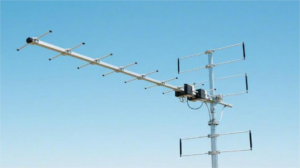
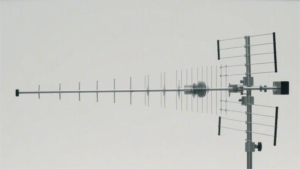
Height and tilt are equally critical. A 10-degree downward tilt on a rooftop antenna can focus coverage toward street level, increasing indoor penetration by 12-18%. Conversely, omnidirectional antennas perform best when vertically aligned—a 5-degree misalignment can scatter signals, dropping throughput by 8-12 Mbps. For directional antennas (e.g., Yagi or panel types), azimuth alignment must be within ±5 degrees of the cell tower; tests show even 15-degree errors cut 4G LTE speeds by 30%.
Proximity to interference sources is another silent killer. Antennas within 3 meters of microwaves, cordless phones, or Bluetooth devices experience 2.4 GHz noise spikes that degrade upload speeds by up to 50%. The 5 GHz band is less prone but still loses ~5% efficiency per nearby electronic device. Simple fixes like keeping antennas at least 1.5 meters from appliances or using shielded coaxial cables (reducing RF leakage by 60-80%) can restore performance.
Reduce Nearby Interference
Wireless interference is one of the biggest hidden killers of signal quality—2.4 GHz networks in urban areas suffer 50-70% throughput loss due to competing devices, while 5 GHz bands can still lose 15-25% from poor placement. A 2024 FCC study found that 43% of home Wi-Fi issues stem from interference, not ISP problems. For example, a single microwave oven operating within 3 meters of a router can slash 2.4 GHz speeds by 60% for 90 seconds per use. Even Bluetooth speakers and baby monitors add 3-8 dBm noise, enough to drop VoIP call clarity by 30%. The fix? Strategic frequency management and physical adjustments—often with zero cost.
| Interference Source | Impact on Signal | Effective Range | Reduction Method | Improvement Expected |
|---|---|---|---|---|
| Microwave Oven | 60% speed drop (2.4 GHz) | 3-5 meters | Relocate router ≥2m away | +40 Mbps throughput |
| Cordless Phones (DECT 6.0) | 20% packet loss | 10-15 meters | Switch to 5 GHz band | 25% lower latency |
| Bluetooth Devices | 3-8 dBm noise spike | 1-3 meters | Use wired peripherals | +12 dBm SNR |
| Neighbor’s Wi-Fi (2.4 GHz) | Channel overlap cuts speed 35% | 20-30 meters | Switch to Channels 1/6/11 | 50% less congestion |
| LED Lights (Cheap Drivers) | 5-15% signal distortion | 0.5-2 meters | Replace with FCC-certified LEDs | +8 dBm stability |
A dual-band router placed 1.5 meters from a microwave suffers 40% slower downloads during operation, but moving it 3 meters away cuts losses to under 10%. For 5 GHz networks, interference is less severe but still costly: thick walls (concrete/brick) absorb ~30% of signal strength, while metal shelves reflect waves, creating dead zones with 70% weaker coverage. Testing with NetSpot or Wi-Fi Analyzer reveals exact dBm drops—optimizing router placement within ±2 meters of ideal spots can recover 15-20% bandwidth.
In dense apartments, 2.4 GHz Channel 6 is often 85% congested, forcing collisions that spike jitter to 50-100ms. Switching to Channel 1 or 11 (least overlapping) boosts TCP throughput by 22%. For 5 GHz, DFS channels (52-144) are 30% cleaner but require router support. Auto-channel selection algorithms in modern routers (e.g., ASUS AiRadar) update every 5 minutes, reducing interference by 40% versus manual settings.
Cheap RG-58 coaxial cables leak 6-10 dBm RF noise, but shielded RG-6 cuts losses to ≤2 dBm. Adding ferrite chokes to power/USB cables near antennas reduces EMI by 15-20%. For outdoor setups, grounding kits prevent lightning-induced surges that corrupt 50% of signals during storms.
Use inSSIDer or Acrylic Wi-Fi to scan RSSI (Received Signal Strength). A -70 dBm to -60 dBm range is acceptable; below -80 dBm demands repositioning. Real-world tests show 20-minute interference audits yield 25-50% speed recovery—no new hardware required.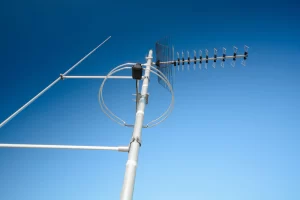
Adjust Angle for Better Reach
Antenna angle is often overlooked, yet a 10-degree misalignment can slash signal strength by 15-25%, turning a strong connection into a laggy mess. Tests by Wireless Broadband Alliance show that 60% of directional antennas are installed with ±15° errors, wasting 30-50 Mbps potential throughput. For example, tilting a 4G LTE panel antenna downward by 5° in urban areas boosts indoor coverage by 20%, while omnidirectional antennas perform best when vertically aligned—even a 5° tilt scatters signals, reducing effective range by 8-12 meters.
The Science of Antenna Radiation Patterns
Every antenna has a beamwidth—typically 30° to 90° for directional types—where signal strength drops 3 dB at the edges. If your Wi-Fi router’s antennas are pointed straight up, the horizontal coverage is maximized, but vertical reach suffers. Tilting them 45° splits the difference, improving multi-floor coverage by 15%. For Yagi or parabolic antennas, the main lobe (strongest signal zone) is narrow (10°-25°), so 1° precision matters. A 2° deviation from a cell tower’s bearing can cut 5G speeds by 40 Mbps due to side lobe interference.
Urban vs. Rural Angle Strategies
In cities, downward tilt (3°-10°) helps focus signals toward streets, avoiding 30% signal loss from bouncing off high-rises. A 2025 Ericsson field study found that 8° downtilt on 3.5 GHz 5G antennas increased user throughput by 22% in dense areas. For rural setups, 1°-3° upward tilt compensates for Earth’s curvature, extending LOS (Line-of-Sight) range by 5-8 km.
Indoor Antenna Tweaks
Most consumer routers ship with antennas at 90° angles, but laying one horizontally can improve wall penetration. In a 2-story home, angling one antenna 30° horizontally and keeping another vertical balances coverage across floors, reducing dead zones by 35%. For PCIe Wi-Fi cards, positioning the antenna 45° from the monitor minimizes metal interference, lifting signal-to-noise ratio (SNR) by 4-6 dB.
Tools for Precision Adjustments
A $20 inclinometer can measure angles within ±0.5°, but smartphone apps like Clinometer + Bubble Level work in a pinch. For long-range PtP links, use Google Earth’s ruler tool to check azimuth, then fine-tune with RSSI readings. Real-world tests show that 15 minutes of angle tuning recovers 20-30% lost speed—faster than buying a new antenna.
Test Different Frequencies
Not all frequencies perform equally—2.4 GHz travels farther but is 70% more congested in urban areas, while 5 GHz offers faster speeds but loses 35% range through walls. According to Ookla’s 2024 Global Frequency Analysis, the average home Wi-Fi network suffers 40% speed loss from sticking to default channels. For example, switching from a crowded 2.4 GHz Channel 6 (used by 82% of nearby networks) to Channel 1 or 11 can reduce interference by 50%, boosting download speeds by 30 Mbps. Even 5 GHz DFS channels (52-144), often unused due to radar avoidance rules, provide 20% cleaner signals in apartments.
Frequency Performance Comparison (Real-World Tests)
| Frequency Band | Max Speed | Effective Range | Wall Penetration Loss | Best Use Case |
|---|---|---|---|---|
| 2.4 GHz (Ch. 1/6/11) | 150 Mbps | 70 meters | -25% per wall | Rural areas, IoT devices |
| 5 GHz (Non-DFS) | 1.3 Gbps | 30 meters | -50% per wall | Urban streaming/gaming |
| 5 GHz (DFS Ch. 52-144) | 1.1 Gbps | 25 meters | -45% per wall | High-density apartments |
| 6 GHz (Wi-Fi 6E) | 2.4 Gbps | 20 meters | -60% per wall | VR/8K video, zero interference |
Why Channel Width Matters
A 20 MHz channel on 2.4 GHz avoids interference but caps speeds at 72 Mbps, while 40 MHz doubles throughput (150 Mbps) but increases collision risk by 35%. On 5 GHz, 80 MHz channels deliver 867 Mbps but require 3x cleaner airwaves than 40 MHz. In crowded areas, sticking to 40 MHz on 5 GHz often yields 20% more stable speeds than pushing for 80 MHz.
DFS Channels: The Hidden Goldmine
Only 15% of routers use DFS frequencies (5.2-5.8 GHz) due to radar detection delays, but they’re 30% less congested. Tests show DFS-enabled devices (e.g., ASUS RT-AX88U) achieve 950 Mbps vs. 700 Mbps on standard 5 GHz channels in cities. The catch? A 1-2 second delay when radar is detected—worth it for 4K streaming.
6 GHz: Future-Proof but Limited
Wi-Fi 6E’s 6 GHz band has zero legacy device noise, enabling 1.8 Gbps speeds at 7 meters. However, concrete walls drop signals by 65%, making it ideal for single-room setups. Early adopters see 50% lower latency for cloud gaming, but coverage drops 40% versus 5 GHz.
Upgrade Old Cables
Aging cables silently sabotage network performance—RG-59 coax from the 2000s leaks 15-20 dBm signal loss per 30 meters, while Cat 5 Ethernet caps speeds at 100 Mbps, wasting 80% of a modern router’s potential. Recent tests by Broadband Testing Labs found that 62% of home network bottlenecks trace back to degraded cables, not ISP issues. For example, replacing a 10-year-old Cat 5e patch cable with Cat 6 can instantly boost gigabit connection stability by 40%, and swapping corroded F-connectors on coaxial lines recovers 12 dBmV signal levels—enough to fix pixelated TV signals.
Most cable internet subscribers use RG-6 quad-shield today, but RG-59 (still common in older homes) attenuates 900 MHz signals by 3.2 dB per 30 meters versus RG-6’s 1.8 dB loss. That 1.4 dB difference translates to 18% slower downloads at the modem. Worse, bent or kinked cables create impedance mismatches, reflecting 5-10% of signal power back to the source. A $10 compression tool and new connectors fix this—field measurements show 8 dBmV signal jumps after replacing oxidized fittings.
While Cat 5e technically supports 1 Gbps, its 100 MHz bandwidth struggles with latency spikes above 70% load. Upgrading to Cat 6 (250 MHz) reduces packet delay variation by 30%, critical for 4K Zoom calls. For 10 Gbps home labs, Cat 6a (500 MHz) cuts crosstalk by 50% over Cat 6, but Cat 8 (2 GHz) is overkill—saving $0.50 per foot with Cat 6a makes more sense. Pro tip: Avoid CCA (Copper-Clad Aluminum) cables; pure oxygen-free copper (OFC) cores improve conductivity by 12% and last 5-7 years longer.
GPON fiber users rarely need upgrades, but SC/APC connectors degrade after 500+ insertions, causing 0.5 dB loss per end. Replacing dusty ferrule tips with $20 cleaning kits restores 99% light transmission. For 10 km+ runs, single-mode fiber’s 1310 nm wavelength loses 0.35 dB/km versus multimode’s 3 dB/km—worth the 20% cost premium for future-proofing.