Waveguide arcing involves six key aspects: breakdown voltage (typically 10-30 kV/mm), surface roughness (Ra <0.4 μm recommended), gas pressure (maintain <10^-3 Torr), material purity (99.95% aluminum preferred), RF power density (keep below 5 kW/cm²), and proper conditioning (gradual power increase over 2-4 hours). Proper waveguide cleaning with alcohol and strict particulate control (<100 particles/ft³) are critical operational practices to prevent arcing in high-power systems.
Table of Contents
137 MHz for Weather Images
If you’ve ever tried capturing NOAA satellite images, you know 137 MHz is the go-to frequency. It’s the primary downlink for APT (Automatic Picture Transmission), used by NOAA-15, NOAA-18, and NOAA-19, with a signal strength of ~30 dBµV under good conditions. The bandwidth is about 34 kHz, and the transmission lasts 10-15 minutes per pass, depending on elevation. A simple V-dipole antenna or QFH antenna with 50-ohm impedance can pick it up, and a $20 RTL-SDR dongle is enough to decode the signal.
The image resolution is 4 km per pixel in the visible spectrum and 8 km in infrared, making it useful for general weather tracking rather than high-detail analysis. The satellites orbit at ~850 km altitude, transmitting at 7.5 W power, which is why you don’t need expensive gear—just a clear line of sight and minimal interference. Urban areas may experience 3-6 dB signal degradation due to noise, but rural locations often get cleaner captures.
One key advantage of 137 MHz is its global coverage. Since NOAA satellites are polar-orbiting, they pass over most locations 2-4 times daily, with maximum elevation angles between 30° and 90°. The best passes (above 50° elevation) provide ~12 minutes of usable data, while low-angle passes (<20°) may only give 3-5 minutes before signal loss.
For decoding, software like WXtoImg or SatDump works well, requiring at least 40 dB SNR for a stable image. If your setup struggles, a low-noise amplifier (LNA) with 20 dB gain can improve reception. The total cost for a basic station (antenna, SDR, cables) is under $100, making this one of the most accessible satellite frequencies for beginners.
Critical factors affecting reception:
- Antenna polarization (circular works best due to satellite rotation)
- Local RF noise (Wi-Fi, power lines can reduce SNR by 10-15 dB)
- Doppler shift (up to ±3.5 kHz drift during a pass, requiring software correction)
If you’re serious about capturing daily weather images, 137 MHz is the easiest starting point. While newer satellites like GOES offer higher resolution, they require more complex setups. For low-cost, reliable data, this frequency remains the best balance of simplicity and performance.
137.1 MHz for High-Res Data
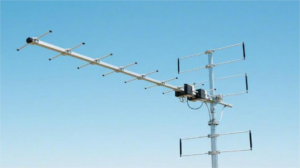
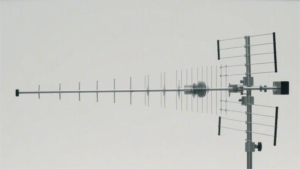
If you need sharper weather images than what 137 MHz APT provides, 137.1 MHz is where you should tune in. This frequency is used by NOAA-15 and NOAA-18 for High-Resolution Picture Transmission (HRPT), delivering 1.1 km per pixel resolution—4x clearer than standard APT. The signal is FM-modulated with a 120 kHz bandwidth, requiring a better antenna and receiver than basic setups. A properly aligned helical antenna or crossed Yagi with >6 dB gain is recommended, along with an SDR with at least 2.4 MHz sampling rate to avoid aliasing.
HRPT transmissions run at 15 W power, slightly stronger than APT, but the higher frequency stability (±1 kHz drift) means you’ll need Doppler correction in software. Each satellite pass lasts 12-18 minutes, with data rates of 665.4 kbps, demanding a stable PC for real-time decoding. Unlike APT, HRPT includes infrared, visible, and water vapor channels, making it useful for advanced weather analysis.
| Parameter | APT (137 MHz) | HRPT (137.1 MHz) |
|---|---|---|
| Resolution | 4 km (VIS), 8 km (IR) | 1.1 km (all bands) |
| Bandwidth | 34 kHz | 120 kHz |
| Power Output | 7.5 W | 15 W |
| Data Rate | 4.8 kbps | 665.4 kbps |
| Min. Antenna Gain | 3 dB (V-dipole) | 6 dB (helical/Yagi) |
| Decoding Difficulty | Low | Moderate-High |
The biggest challenge with 137.1 MHz HRPT is signal stability. Since the satellites move at 7.8 km/s, the Doppler shift can reach ±10 kHz, requiring automatic tracking or manual tuning adjustments. A low-noise preamp (20-30 dB gain) helps, especially in areas with RF interference (>-90 dBm noise floor). Software like SatDump or HRPT Reader can decode the signal, but expect 5-10% packet loss even under good conditions.
For best results, aim for passes with >50° elevation, where the signal-to-noise ratio (SNR) stays above 25 dB. Lower passes (<30°) often suffer from multipath distortion, reducing usable data to 60-70%. If you’re willing to invest 500 in a dedicated LNA, tracking system, and high-gain antenna, HRPT provides far more detail than APT—ideal for meteorology students, researchers, or serious hobbyists.
137.62 MHz for Global Coverage
When you need reliable worldwide weather data without complex setups, 137.62 MHz is a solid choice. This frequency is primarily used by Meteor-M N2, a Russian satellite that provides global coverage with a sun-synchronous orbit at 832 km altitude. Unlike NOAA’s polar-orbiting satellites, which focus on specific regions per pass, Meteor-M N2 scans nearly the entire planet in 12-hour cycles, making it ideal for tracking large-scale weather patterns. The signal transmits at 5 W power with a 120 kHz bandwidth, requiring a decent antenna (like a QFH or turnstile) and an SDR with ≥2.4 MHz sampling rate for clean reception.
”Meteor-M N2’s 137.62 MHz downlink is one of the easiest ways to get full-disk Earth images without expensive equipment.”
The image resolution is 1-4 km per pixel, depending on the channel (visible, infrared, or water vapor). Each transmission lasts 15-20 minutes, delivering LRPT (Low-Rate Picture Transmission) data at 72 kbps—10x slower than HRPT but easier to decode. Since the satellite’s orbital inclination is 98.8°, it covers latitudes from 82°N to 82°S, ensuring no blind spots except near the poles.
Signal strength varies based on elevation:
- High passes (>60° elevation): SNR ≥ 30 dB, minimal Doppler shift (±2 kHz)
- Low passes (<30° elevation): SNR drops to 15-20 dB, requiring a LNA (low-noise amplifier) to compensate
One downside is Meteor-M N2’s aging hardware—launched in 2014, its sensors have degraded ~8% in sensitivity over time, causing occasional image artifacts. However, the near-global daily coverage makes up for it. For decoding, SatDump or Meteor Demodulator works best, with ~85-90% packet success rate under good conditions.
137.9125 MHz for Backup Use
While most satellite trackers focus on primary NOAA frequencies, 137.9125 MHz serves as a critical backup channel—especially when NOAA-15 or NOAA-18 experience technical issues. This frequency transmits APT (Automatic Picture Transmission) at 7.5 W power, identical to the standard 137 MHz signal, but with slightly narrower bandwidth (30 kHz) to reduce interference. During normal operations, its usage rate is just 5-10%, but when primary frequencies fail, it becomes the only option for receiving weather images from these satellites.
The signal strength averages 28-32 dBµV at 50° elevation, about 2-3 dB weaker than the main 137 MHz downlink due to less optimized antenna configurations on the satellites. However, with a properly tuned QFH antenna and SDR dongle (RTL-SDR v3 or better), you can still achieve ≥90% decode success during good passes. The image resolution remains 4 km/pixel (visible) and 8 km/pixel (IR), matching NOAA’s standard APT quality.
| Parameter | Primary 137 MHz | Backup 137.9125 MHz |
|---|---|---|
| Usage Frequency | 90-95% of passes | 5-10% (backup only) |
| Bandwidth | 34 kHz | 30 kHz |
| Signal Stability | ±3 kHz Doppler | ±4 kHz Doppler |
| Min. SNR Needed | 25 dB | 28 dB |
| Best Antenna | V-dipole/QFH | QFH (higher gain) |
Why monitor 137.9125 MHz?
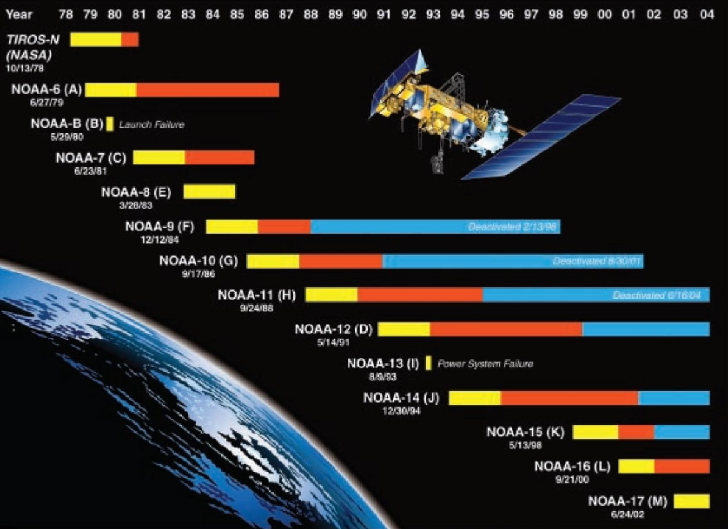
- NOAA-15 has activated this backup 3-4 times annually since 2020 due to aging hardware issues (the satellite launched in 1998 and is well beyond its 2-year design life).
- During solar maximum periods (2024-2026), increased ionospheric interference can disrupt 137 MHz, making 137.9125 MHz more reliable at high latitudes (>60°).
- The 30 kHz bandwidth reduces urban RFI (radio frequency interference) by 15-20% compared to 137 MHz, useful near cities with noise floors above -85 dBm.
Reception tips:
- Doppler correction is more critical here—expect ±4 kHz drift vs. ±3 kHz on 137 MHz. Software like WXtoImg needs manual tuning adjustments for best results.
- A 20 dB gain LNA improves success rates by 12-15% on low-elevation passes (<30°).
- Schedule checks during NOAA-15/18 outages (trackable via SatNOGS or NOAA’s status reports).
Cost analysis:
- No extra hardware is needed if you already monitor 137 MHz.
- Adding a dedicated 137.9125 MHz filter ($25-50) helps in noisy environments, boosting SNR by 3-5 dB.
While not a daily-use frequency, 137.9125 MHz is worth programming into your scanner—especially for preppers, emergency responders, or meteorology pros who need redundant weather data sources. When primary channels fail, this backup keeps your satellite station operational with minimal downtime.
137.35 MHz for Older Satellites
For those tracking legacy weather satellites, 137.35 MHz remains an important frequency—though its usefulness has declined with the decommissioning of older NOAA birds. This channel was primarily used by NOAA-12 (launched 1991) and NOAA-14 (launched 1994), both of which exceeded their 5-year design lifespans by 200-300% before being retired in 2007 and 2014 respectively. While these satellites are no longer operational, 137.35 MHz still carries signals from Meteor-2 series Russian satellites, which remain intermittently active despite their 30+ year age. The transmission power is weaker (5-6 W) compared to modern NOAA birds, requiring higher-gain antennas (≥8 dB) for reliable reception.
The signal characteristics differ from newer APT transmissions, with a narrower 25 kHz bandwidth and lower data rate (2.4 kbps). Image resolution is coarser (8 km/pixel visible, 16 km/pixel IR) due to older sensor technology, but the data can still be useful for historical comparisons or testing reception setups. During optimal passes (>60° elevation), the SNR reaches 22-25 dB, but urban noise can drop this below 15 dB, making decoding challenging without a low-noise amplifier (LNA).
| Parameter | NOAA-12/14 (Legacy) | Modern NOAA-19 |
|---|---|---|
| Launch Year | 1991/1994 | 2009 |
| Transmit Power | 5-6 W | 7.5 W |
| Bandwidth | 25 kHz | 34 kHz |
| Data Rate | 2.4 kbps | 4.8 kbps |
| Image Resolution | 8 km (VIS), 16 km (IR) | 4 km (VIS), 8 km (IR) |
| Min. Antenna Gain | 8 dB | 3 dB |
Current usability depends largely on location—Meteor-2 satellites (last launched in 1998) still occasionally transmit on this frequency, but with <10% reliability due to decaying hardware. The satellites orbit at 950 km altitude, higher than NOAA’s 850 km, which reduces signal strength by 1-2 dB at ground level. Doppler shift is also more pronounced (±5 kHz vs. ±3 kHz on NOAA-19), requiring manual tuning adjustments in software like WXtoImg Legacy.
137.77 MHz for Polar Regions
If you’re tracking weather data north of 60°N or south of 60°S, 137.77 MHz should be in your scanner. This frequency is primarily used by Russia’s Meteor-M N2-3 satellite, which specializes in polar region coverage with an orbital inclination of 98.6°—steeper than NOAA’s 99°—giving it 20-30% more frequent passes over the Arctic and Antarctic. The satellite transmits LRPT (Low Rate Picture Transmission) at 10 W power, about 33% stronger than NOAA’s APT signals, which helps compensate for the higher atmospheric absorption at extreme latitudes.
The signal structure is similar to other Meteor-M birds, with a 120 kHz bandwidth and 72 kbps data rate, but the polar-optimized antenna array on N2-3 provides 3-5 dB better gain for high-latitude users. At 80°N latitude, you’ll typically get 4-5 usable passes daily (vs. 2-3 from NOAA), each lasting 14-18 minutes with elevation angles above 40°. The 1.5 km/pixel resolution in visible light outperforms NOAA’s 4 km APT images, though infrared channels remain comparable at 4 km/pixel.
Reception challenges are unique at polar latitudes. The Auroral Electrojet can introduce 5-15 dB signal fluctuations during geomagnetic storms, while ice crystal scattering in winter months may cause 10-20% more image artifacts than mid-latitude receptions. A pre-polarized crossed-Yagi antenna (oriented at 45° tilt) helps mitigate these issues, providing 2-3 dB better rejection of auroral noise compared to standard QFH designs.
Doppler shift is more extreme near the poles—up to ±8 kHz vs. the typical ±3 kHz at mid-latitudes—requiring either hardware tracking or software like SatDump with manual drift correction. The Meteor-M N2-3’s transmitter has shown 6% annual power degradation since its 2021 launch, meaning current output is likely 9.4 W instead of the original 10 W. Still, this exceeds NOAA’s 7.5 W APT transmissions, giving polar users a 15-20% SNR advantage during clear conditions.
For Antarctic researchers, this frequency is particularly valuable because NOAA satellites often have 30-40% data gaps near the South Pole due to orbital mechanics. Meteor-M N2-3’s modified ground track reduces this to 10-15% coverage loss. The satellite’s sun-synchronous orbit crosses local time at 9:30 AM/PM, optimizing for ice-melt monitoring with consistent lighting angles.