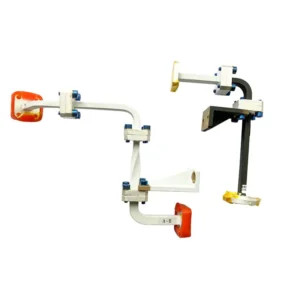
Choose a broadwall multi-hole coupler when you need high directivity for reflection measurements. Choose a crossguide coupler when you mainly need a power sample and have limited space along the main line. A crossguide model is suitable only if its directivity and operating bandwidth meet your measurement requirements. A broadwall model still needs enough clearance for its longer coupling section.
For example, Dolph’s published crossguide range specifies 18 dB minimum directivity. Its broadwall range lists minimum values of 20–38 dB, depending on configuration. That difference matters much more when measuring a small reflection than when monitoring forward power into a well-matched load.


Compare the Available Configurations
| Specification | Broadwall Multi-Hole | Crossguide |
|---|---|---|
| Waveguide sizes | WR650–WR28 | WR430–WR28 |
| Published coupling range | 3–40 dB | 18–60 dB; standard nominal values of 20, 30, 40, 50, and 60 dB |
| Minimum directivity | 20–38 dB, depending on configuration | 18 dB |
| Nominal coupling accuracy | ±0.7 dB | ±0.7 dB |
| Frequency sensitivity | ±1 dB | ±1 dB within the specified operating bandwidth |
| Physical arrangement | Parallel waveguides with distributed coupling holes | Crossed waveguides with a concentrated coupling region |
The broadwall configurations include different port arrangements and directivity limits. If you require at least 30 dB, a configuration guaranteed only to 20 or 25 dB is unsuitable.
The crossguide specifications list 10–20% typical operating bandwidth. Ask the supplier to confirm how that percentage is defined and which start and stop frequencies carry the stated ratings. The waveguide band in a model table does not establish the coupler’s usable measurement bandwidth.
Match Coupling to the Instrument
| Coupling | Power Sampled | 10 W Main-Line Power | 100 W Main-Line Power |
|---|---|---|---|
| 20 dB | 1% | 100 mW | 1 W |
| 30 dB | 0.1% | 10 mW | 100 mW |
| 40 dB | 0.01% | 1 mW | 10 mW |
| 50 dB | 0.001% | 0.1 mW | 1 mW |
Instrument input (dBm) = main-line power (dBm) − coupling (dB) − sample-path loss (dB).
Suppose the main-line power ranges from 1 to 100 W, the instrument’s specified measurement range is −20 to +10 dBm, and the sample path adds 3 dB loss. Ignoring tolerances, coupling must fall between 37 and 47 dB. A 40 dB coupler produces approximately −13 to +7 dBm at the instrument.
Include losses from the waveguide-to-coaxial adapter, cable, and attenuator at the operating frequency. Calculate the highest instrument input using the lowest actual coupling and path loss. Calculate the lowest input using their highest values.
For example, 100 W with 39.3 dB actual coupling produces about 11.7 mW before added attenuation. A nominal 40 dB label therefore does not guarantee compliance with a 10 mW input limit.
Separate Power Monitoring from Reflection Measurement
A forward-power monitor measures the stronger travelling wave. A reflection channel may need to measure a signal tens of decibels below it. Finite directivity allows the unwanted wave into either channel; the resulting error also depends on load reflection and phase. NIST’s reflectometer analysis identifies directivity and equivalent source mismatch as measurement-error sources.[1]
Table of Contents
Forward-Power Monitoring
Consider 18 dB effective directivity and a load with 20 dB return loss. In a simplified normalized model, the unwanted reflected-wave contribution is about 1.26% of the desired forward-sample amplitude. Depending on phase, it produces approximately −2.5% to +2.5% forward-power error, before coupling, sensor, and other system errors.
That may be acceptable for routine monitoring. It is not sufficient evidence for a system requiring ±1% total power accuracy. A poorly matched load increases this error.
Small-Reflection Measurements
At 100 W incident power and 30 dB return loss, reflected power is 100 mW. After 40 dB coupling, the reflected sample is only 10 μW, or −20 dBm. The forward sample is 30 dB stronger.
| Effective Directivity Above Return Loss | Leakage Amplitude Relative to the Reflection | Return-Loss Reading Error |
|---|---|---|
| 10 dB | 31.6% | Approximately −2.39 to +3.30 dB |
| 20 dB | 10% | Approximately −0.83 to +0.92 dB |
| 30 dB | 3.16% | Approximately −0.27 to +0.28 dB |
The reflection-channel calculation uses 10−(D−RL)/20; the forward-channel example uses 10−(D+RL)/20. D is effective directivity and RL is load return loss, both in dB. These models assume a common reference plane and normalized paths. They exclude noise, other mismatch errors, and temperature drift.
Measuring 30 dB return loss with roughly ±1 dB error from directivity alone requires about 50 dB effective directivity. Neither standard product range above guarantees that performance. A specially specified device or suitable system error correction would be needed.
Use the system’s effective directivity for this calculation, not a typical component rating. Isolation is also different: with consistent port definitions and matched conditions, 60 dB isolation minus 30 dB coupling gives 30 dB directivity.
Check Coupling Across the Operating Band
A nominal 40 dB coupler measuring 40.8–41.0 dB across its band has only 0.2 dB peak-to-peak variation. Its absolute coupling still differs from nominal by 0.8–1.0 dB.
An uncorrected coupling error of ±0.5 dB produces approximately −10.9% to +12.2% power error. If coupling alone is allowed to contribute no more than ±5%, the symmetric coupling-error limit is approximately ±0.21 dB.
For an 8.2–12.4 GHz application, request coupling and directivity data covering that range, with agreed test frequencies and limits. Ask whether nominal coupling accuracy and frequency sensitivity are separate allowances or overlapping specifications.
Measured coupling corrections can reduce systematic error, but reference calibration, mismatch, and coupler nonlinearity still belong in the uncertainty budget. NIST’s high-power wattmeter calibration work treats these as separate contributions.[2]
Compare Loss and Power Ratings
A 10 dB coupler takes 10% of the input power through its sample port. That split alone causes approximately 0.458 dB of ideal main-line loss. At 40 dB coupling, the corresponding value is approximately 0.00043 dB. Compare insertion loss at the same frequency and coupling value, and confirm whether the specification includes this power split.
For flat rectangular pulses with negligible power between pulses, 10 kW peak power at 1% duty cycle equals 100 W average power. A 40 dB coupler produces a sample of 1 W peak and 10 mW average.
The sample connector, sensor, and termination must handle their applicable peak and average powers at the specified pulse width. Dolph’s standard crossguide sheet does not publish CW or peak-power limits; obtain written confirmation rather than inferring them from the waveguide size.
Check Installation and Port Connections
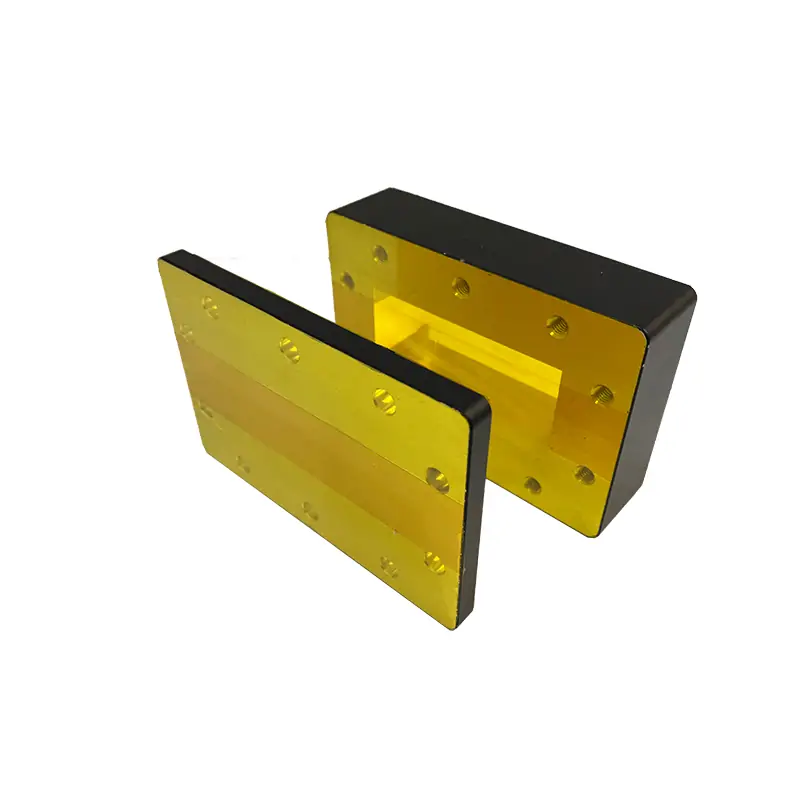
If the available space is 120 mm along the main line and 80 mm to the side, a 100 mm-long coupler with a side arm extending 90 mm will not fit. Allow room for connectors, cable bends, and bolt access.
A three-port unit may contain an internal termination; a four-port unit may require an external matched load. Verify the port diagram, termination rating, and mating EIA or IEC flange before treating either design as a replacement.
Specify What Must Be Guaranteed
An inquiry that says “WR90, 40 dB coupler” leaves the measurement accuracy and mechanical fit unresolved. Include:
- Operating frequencies: exact start and stop frequencies, not just the waveguide band.
- Measurement limits: coupling tolerance, minimum directivity, maximum VSWR, and insertion loss.
- Power conditions: minimum and maximum CW power, or peak power, pulse width, and duty cycle.
- Interfaces: flange designation, sample connector, port orientation, and available dimensions.
- Acceptance data: required frequency curves, test conditions, and an approved outline drawing.
Product figures are taken from the linked Dolph Microwave specifications. Numerical examples are calculated under the stated assumptions, not measurements of the pictured products. Confirm the selected model’s ratings in the quotation and approved drawing.