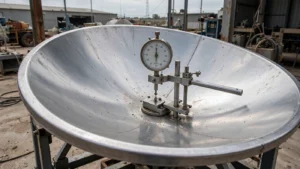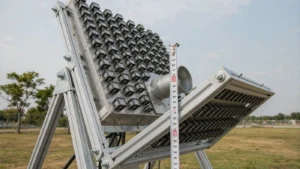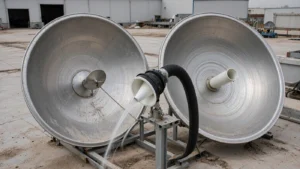
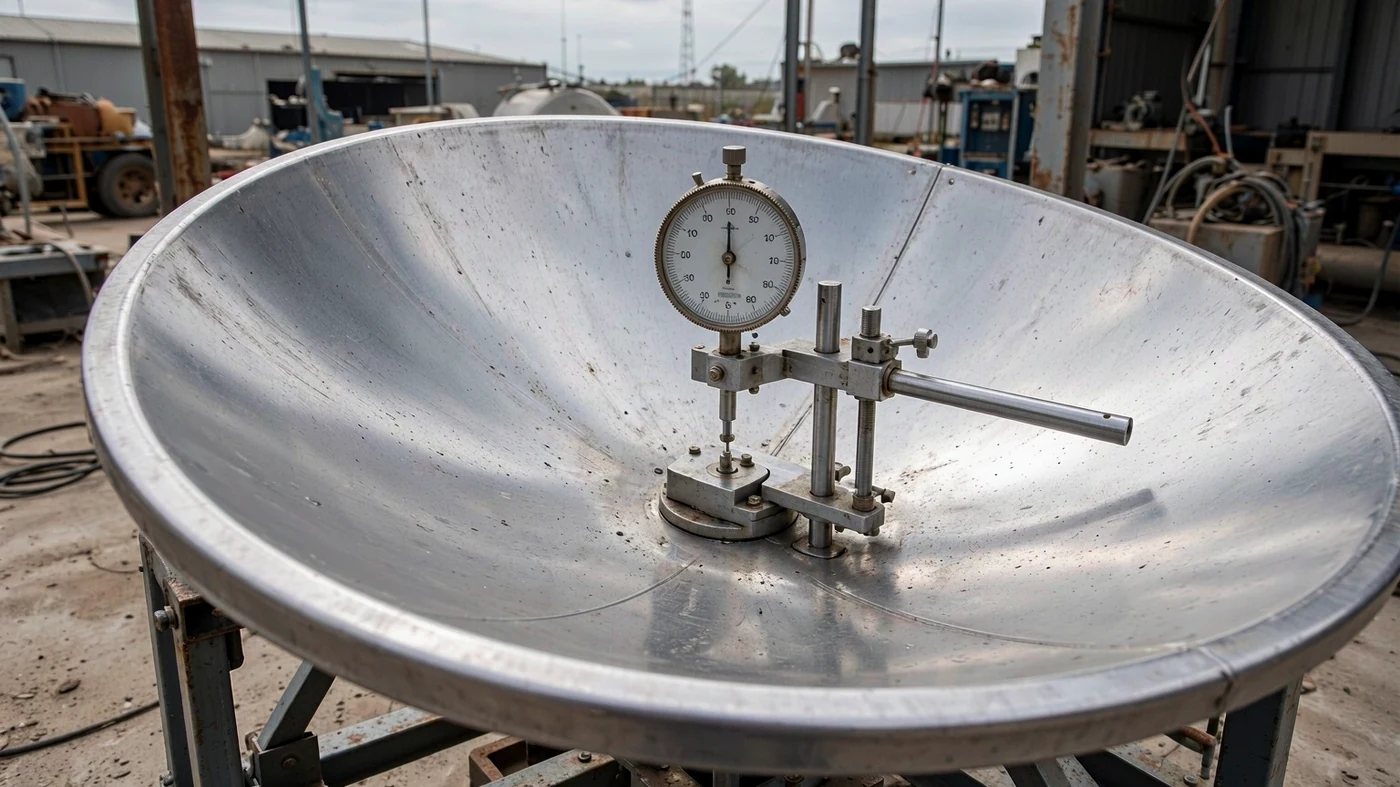
Reflector surface errors reduce Ka-band gain by disrupting phase alignment across the aperture and scattering power away from the main beam. For random surface errors at 30 GHz, the Ruze equation predicts approximately 0.62 dB of gain reduction at 0.3 mm RMS, 1.72 dB at 0.5 mm RMS, and 6.87 dB at 1.0 mm RMS, relative to an otherwise identical error-free reflector. The shorter the wavelength, the tighter the required surface tolerance [1].
The practical question is not whether a dish meets a generic “Ka-band accuracy” label, but whether its measured surface error fits the gain-loss allowance at your operating frequency.
Table of Contents
Why Ka-Band Needs Tighter Reflector Accuracy
A small surface displacement ϵ produces approximately twice that change in reflected path length near normal incidence. The corresponding phase error is about 4πϵ/λ. At 30 GHz, a local 0.5 mm displacement introduces roughly 0.63 rad, or 36°, of phase error; at 12 GHz, it introduces about 0.25 rad, or 14°. A local dent alone does not determine the whole antenna’s gain loss: its extent and the error distribution also matter [1].
An ITU-hosted satellite-network presentation discusses 27.5–31 GHz uplinks and 17.7–21.2 GHz downlinks. These are useful comparison ranges, not a claim that every frequency is available for every terminal or region [2].
The wavelengths below use λ = c/f and the exact SI value c = 299,792,458 m/s. The λ/16 column is a surface-accuracy rule of thumb, not a mandatory standard or a universal pass/fail limit [3].
| Frequency | Wavelength | λ/16 RMS reference |
|---|---|---|
| 17.7 GHz | 16.94 mm | 1.06 mm |
| 20 GHz | 14.99 mm | 0.94 mm |
| 21.2 GHz | 14.14 mm | 0.88 mm |
| 27.5 GHz | 10.90 mm | 0.68 mm |
| 30 GHz | 9.99 mm | 0.62 mm |
| 31 GHz | 9.67 mm | 0.60 mm |
For equal surface-loss allowance, RMS tolerance scales with wavelength. A reflector used at 30 GHz therefore needs 2.5 times tighter surface accuracy than one used at 12 GHz, with other conditions unchanged [1].
Calculating Surface Loss With the Ruze Equation
For approximately Gaussian random surface errors within the model’s assumptions, surface efficiency is the gain ratio relative to an otherwise identical reflector without those errors [1]:
ηs = exp[−(4πσ/λ)²]
Here, σ is RMS surface error and λ is wavelength, expressed in the same units. The signed gain change is ΔG = 10 log10(ηs), which is negative. The corresponding positive loss allowance is Ls = −10 log10(ηs) = 4.343(4πσ/λ)² dB.
Doubling either frequency or RMS error quadruples the loss expressed in dB. At σ = λ/16, the equation gives ηs ≈ 0.54 and a gain reduction of about 2.68 dB. That is already a substantial penalty, not a high-efficiency design target. The missing main-beam contribution is redistributed by scattering; it is not necessarily absorbed as heat [1].
Ka-Band Gain Loss by Surface Error
The following values are calculations at 30 GHz using λ = 9.9931 mm, not measured specifications of a Dolph Microwave product. Negative values indicate gain reductions relative to the error-free reference.
| RMS surface error σ | Surface efficiency ηs | Gain change at 30 GHz |
|---|---|---|
| 0.1 mm | 0.98 | −0.07 dB |
| 0.2 mm | 0.94 | −0.27 dB |
| 0.3 mm | 0.87 | −0.62 dB |
| 0.4 mm | 0.78 | −1.10 dB |
| 0.5 mm | 0.67 | −1.72 dB |
| 0.6 mm | 0.57 | −2.47 dB |
| 0.7 mm | 0.46 | −3.37 dB |
| 0.8 mm | 0.36 | −4.40 dB |
| 0.9 mm | 0.28 | −5.56 dB |
| 1.0 mm | 0.21 | −6.87 dB |
Same Surface, Different Frequencies
The same 0.5 mm RMS surface incurs approximately 0.76 dB of loss at 20 GHz but 1.72 dB at 30 GHz. A dual-band terminal therefore needs separate surface-loss entries for its receive and transmit frequencies.
| RMS error σ | Gain change at 12 GHz | At 20 GHz | At 27.5 GHz | At 30 GHz |
|---|---|---|---|---|
| 0.2 mm | −0.04 dB | −0.12 dB | −0.23 dB | −0.27 dB |
| 0.3 mm | −0.10 dB | −0.27 dB | −0.52 dB | −0.62 dB |
| 0.5 mm | −0.27 dB | −0.76 dB | −1.44 dB | −1.72 dB |
| 1.0 mm | −1.10 dB | −3.05 dB | −5.77 dB | −6.87 dB |
Surface efficiency is only one factor in overall antenna performance. Illumination taper, spillover, blockage, conductor loss, and mismatch at the feedhorn also affect realized gain. If an illustrative 65% baseline efficiency excludes surface error, multiplying it by ηs ≈ 0.674 gives about 44% at 0.5 mm RMS and 30 GHz. Do not apply that reduction again if the quoted efficiency already includes surface loss.
Which Surface Errors Can the Equation Predict?
Manufacturing deviations, gravitational deformation, thermal distortion, and wind loading can all change reflector shape. A factory measurement describes a particular state, not automatically every operating elevation or environmental condition [1].
Ruze’s statistical model is not a universal conversion from any RMS number to gain. Large-scale systematic errors, such as defocus or coherent sag, require separate analysis. Panel-setting errors are not automatically Gaussian merely because they come from panels; their distribution and spatial correlation matter [1].
NASA’s Application of Ruze Equation for Inflatable Aperture Antennas provides a useful measured warning. The researchers compared surface measurements with RF measurements and found that Ruze predictions overstated directivity degradation for the tested inflatable reflectors. Wrinkles and large-scale shape errors did not match the model assumptions. The report recommends against using the equation to predict performance for those inflatable antennas; it does not invalidate the random-error calculations above [4].
A Worked Surface-Accuracy Specification
Illustrative design scenario: suppose a 30 GHz link allows no more than 1.0 dB for random surface-error loss. Rearranging the same equation gives σmax = (λ/4π)√(Ls/4.343), or approximately 0.382 mm RMS. Under those assumptions, 0.3 mm RMS fits the allowance, while 0.5 mm RMS does not.
Now suppose a surface report gives 0.3 mm RMS at the factory, but the applicable in-service value is 0.5 mm RMS. The calculated loss increases from 0.62 to 1.72 dB, consuming an additional 1.10 dB. This is a calculation example, not a measured temperature or wind response; it shows why the operating-state measurement matters.
What to Request With an RMS Figure
When specifying SATCOM reflector antennas, ask for the surface report as well as the headline tolerance. Surface-coordinate measurements, including photogrammetry or laser scanning, can characterize shape, but a surface map and a verified RF gain result answer different questions [4].
- Confirm the measured aperture, reference surface, and whether a best-fit adjustment removed focus or alignment errors that remain relevant to the installed antenna.
- Request the measurement method, uncertainty, elevation angle, temperature, and wind or loading conditions.
- Check whether the residual errors justify a random-error model. For systematic distortion, request an appropriate electromagnetic analysis or RF measurement.
- Calculate surface loss at each actual operating frequency, and establish whether the supplied gain or efficiency already includes it.
A bare “0.3 mm RMS” figure can support a conditional calculation, but it cannot by itself establish installed gain. Likewise, surface loss at two antennas on one link contributes to that link’s budget; forward and return links should be assessed separately rather than treated as an automatic doubled round-trip loss.
Choosing an Accuracy Target That Protects Gain
Start with the allowable surface-loss budget, then calculate the RMS tolerance at the highest relevant frequency and verify it under the intended operating conditions. At 30 GHz, a 0.3 mm RMS surface corresponds to about 0.62 dB of loss; the λ/16 reference corresponds to about 2.68 dB. Neither number is a universal manufacturing requirement. The right target depends on the loss the link can afford and whether the model describes the measured error pattern [1].
Planning a Ka-band terminal with a tight surface-error budget? Send your frequency, aperture size, and accuracy target for an engineering review.
Request an Engineering Review